Reliable inequality data as a global public good
This report presents the most up-to-date synthesis of international research efforts to track global inequalities.
Contemporary income and wealth inequalities are very large
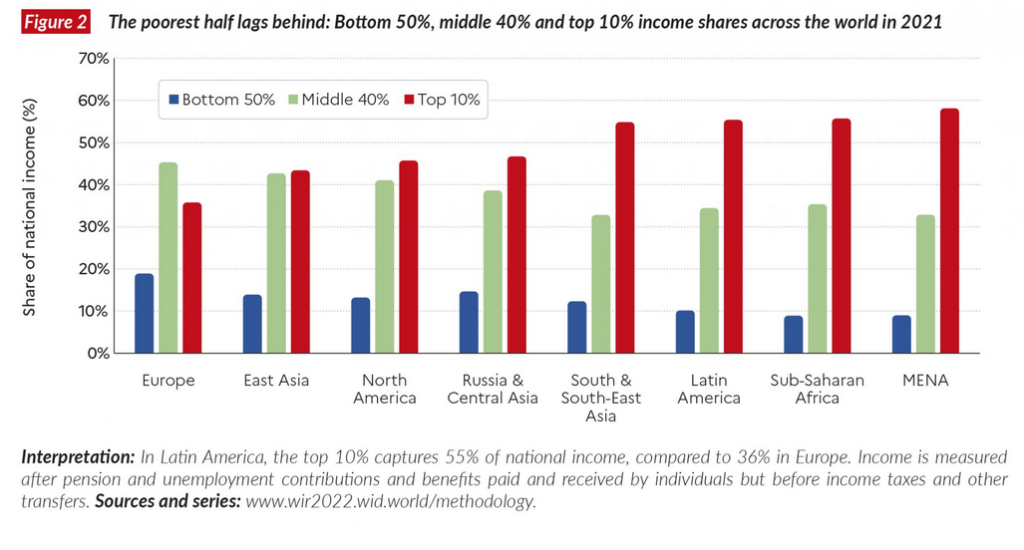
The richest 10% of the global population currently takes 52% of global income, whereas the poorest half of the population earns 8.5% of it. Global wealth inequalities are even more pronounced than income inequalities. The poorest half of the global population barely owns any wealth at all, possessing just 2% of the total. In contrast, the richest 10% of the global population own 76% of all wealth.
MENA is the most unequal region in the world, Europe has the lowest inequality levels
Inequality varies significantly between the most equal region (Europe) and the most unequal (Middle East and North Africa i.e. MENA). In Europe, the top 10% income share is around 36%, whereas in MENA it reaches 58%. In between these two levels, we see a diversity of patterns. In East Asia, the top 10% makes 43% of total income and in Latin America, 55%.

Average national incomes tell us little about inequality
The world map of inequalities reveals that national average income levels are poor predictors of inequality: in low- and middle-income countries, some countries exhibit extreme inequality (e.g. Brazil and India), somewhat high levels (e.g. China) and moderate to relatively low levels (e.g. Malaysia, Uruguay).
Inequality is a political choice, not an inevitability
Income and wealth inequalities have been on the rise nearly everywhere since the 1980s, but the rise has not been uniform. These differences confirm that inequality is not inevitable, it is a political choice.
Contemporary global inequalities are close to early 20th century levels, at the peak of Western imperialism
While inequality has increased within most countries, over the past two decades, global inequalities between countries have declined. This sharp rise in within country inequalities has meant that despite economic catch-up and strong growth in the emerging countries, the world remains particularly unequal today. It also means that inequalities within countries are now even greater than the significant inequalities observed between countries. The share of income presently captured by the poorest half of the world’s people is about half what it was in 1820.
Nations have become richer, but governments have become poor
One way to understand these inequalities is to focus on the gap between the net wealth of governments and net wealth of the private sector. Over the past 40 years, countries have become significantly richer, but their governments have become significantly poorer. The currently low wealth of governments has important implications for state capacities to tackle inequality in the future, as well as the key challenges of the 21st century such as climate change.
Wealth inequalities have increased at the very top of the distribution
The rise in private wealth has also been unequal within countries and at the world level. Global multimillionaires have captured a disproportionate share of global wealth growth over the past several decades: the top 1% took 38% of all additional wealth accumulated since the mid-1990s, whereas the bottom 50% captured just 2% of it.
Wealth inequalities within countries shrank for most of the 20th century, but the bottom 50% share has always been very low
Wealth inequality was significantly reduced in Western countries between the early 20th century and the 1980s, but the poorest half of the population in these countries has always owned very little, i.e. between 2% and 7% of the total. In other regions, the share of the bottom 50% is even lower.
Gender inequalities remain considerable at the global level, and progress within countries is too slow
Overall, women’s share of total incomes from work (labor income) stands at less than 35% today. In a gender equal world, women would earn 50% of all labor income.
Addressing large inequalities in carbon emissions is essential for tackling climate change
Global income and wealth inequalities are tightly connected to ecological inequalities and to inequalities in contributions to climate change. Data set on carbon emissions inequalities reveals important inequalities in CO2 emissions at the world level: the top 10% of emitters are responsible for close to 50% of all emissions, while the bottom 50% produce 12% of the total.
Large inequalities in emissions suggest that climate policies should target wealthy polluters more.
Redistributing wealth to invest in the future
The World Inequality Report 2022 reviews several policy options for redistributing wealth and investing in the future in order to meet the challenges of the 21st century. Given the large volume of wealth concentration, modest progressive taxes can generate significant revenues for governments.
| Year of publication | |
| Publisher | World Inequality Lab |
| Geographic coverage | Global |
| Originally published | 22 Dec 2021 |
| Knowledge service | Metadata | Global Food and Nutrition Security | Food security and food crisesSustainable Food Systems |
| Digital Europa Thesaurus (DET) | social inequalitydistribution of incometax on incomepovertygreenhouse gasclimate changeprivate sectorgender equalitypolicymaking |
