Understanding the future of nutrient pollution
To anticipate these risks and identify effective strategies for increasing water resilience, we used scenario modeling to examine nutrient fluxes from land to sea from 1990 to 2020 and projected changes in nitrogen and phosphorus loadings until 2050. Our analysis accounts for the expected effects of EU environmental policies, climate variability, and socio-economic developments on nutrient pollution from agriculture, wastewaters, and air emissions. Current EU environmental policy makes significant impact in curbing pollution now and in the future, however there is a need to step up efforts in reducing nutrient losses from agriculture.
A Source-to-Sea approach
Our research employs a source-to-sea approach, examining the impacts of nutrient pollution on both freshwater and coastal/marine waters. By linking sources to impacts, our scenario analysis aims to help identify the nutrient reductions needed to achieve water quality objectives for both freshwater and marine waters, ensuring future water security by considering both water quality and quantity.
Explore the Data
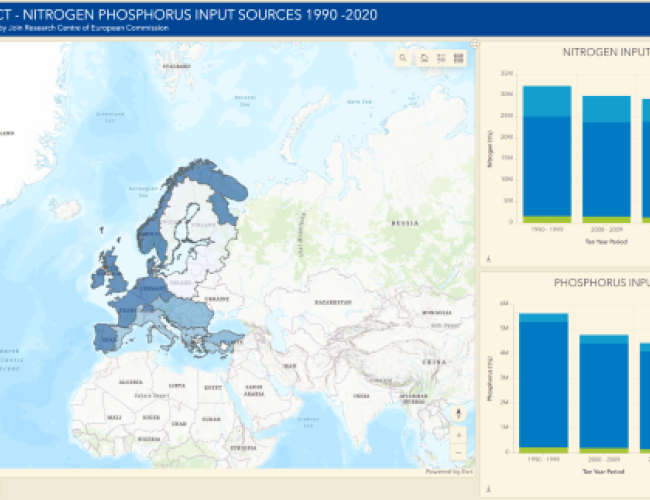
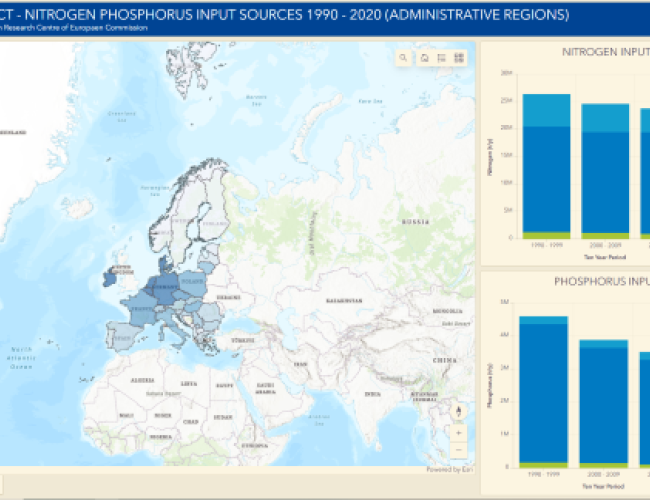
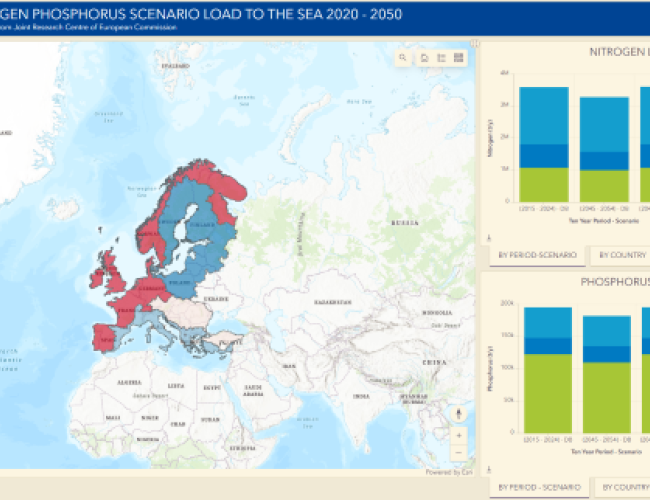
Interactive visualisation tools enables exploration of historical (1990-2020) and projected future changes (2020-2050) in nutrient inputs to river basins, nutrient loads to the sea, and their associated impacts on the European marine environment.
Browse our interactive maps and dashboards to explore historical (1990-2020) and projected future changes (2020-2050) in:
- Nutrient inputs to river basins
- Nutrient loads to the sea
- Impacts on the European marine environment
Note/Disclaimer: Nutrient fluxes are estimated using modeling techniques.
Dashboard content
Dashboards provide simple access to information and tools for you to explore, visualise and summarise data. They are mainly composed of:
MAPS. Providing visual information through the use of a thematic style applied to spatial objects as well as tabular information through the use of a pop-up showing tabular data
CHARTS. Providing aggregate information for the entire domain. An active selection on a map spatial object triggers a filter that allows to summarize selection related data only. It is possible to download data behind the chart aggregation
Available dashboards
Nitrogen and phosphorus input sources 1990-2020
Nitrogen and phosphorus input sources 1990-2020 by official administrative regions
Nitrogen and phosphorus input sources 2020-2050
Nitrogen and phosphorus input sources 2020-2050 by official administrative regions
Nitrogen and phosphorus load to the sea 1990-2020
Nitrogen and phosphorus load to the sea 2020-2050
Current state and future projections for marine basins


