
The effect of the coronavirus on society and the global economy is unprecedented and it will need to trigger extraordinary research efforts.
The aim of this page is to allow the monitoring of the research landscape on Coronavirus. It relies on datasets containing scientific publications, patents, and EU-funded R&D projects. The interactive tool allows the user to navigate the data and customise the visualisation using filters, showing cumulated values, bar charts, etc..
A CORONAVIRUS public space in TIM has been made available for anybody to explore and navigate the data.
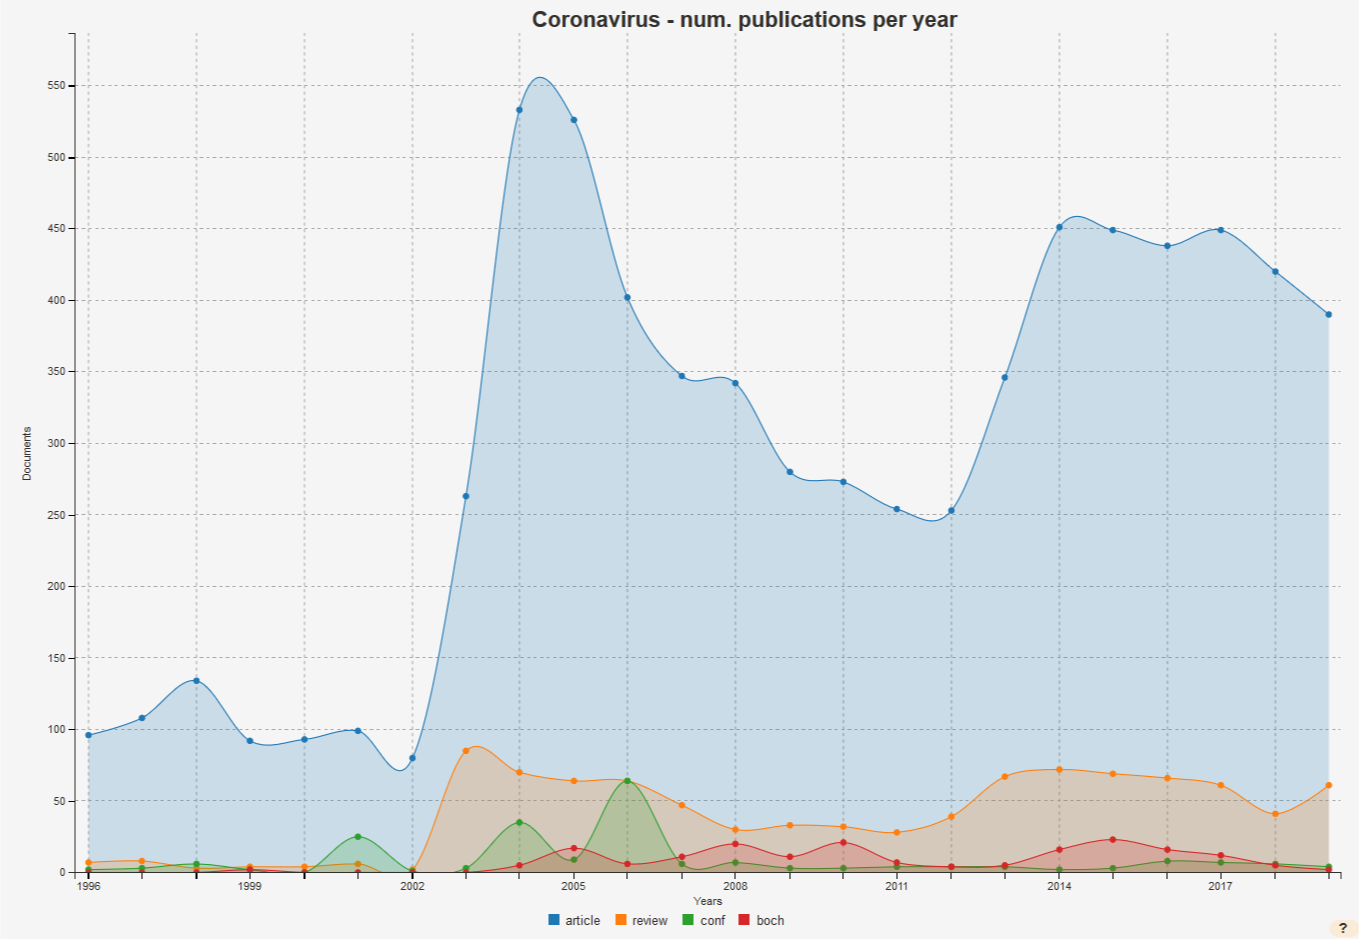
| Coronavirus - Number of scientific publications per year
This visualisation represents the number of new scientific publications related to the topic of coronavirus by year. Two increases of peer-reviewed publications can be observed, corresponding to the SARS and MERS outbreaks respectively in 2003 and 2012. These two peaks are followed by a slow decline in the number of publications. |
Click on the image to go to the visualisation |
||||||||||||
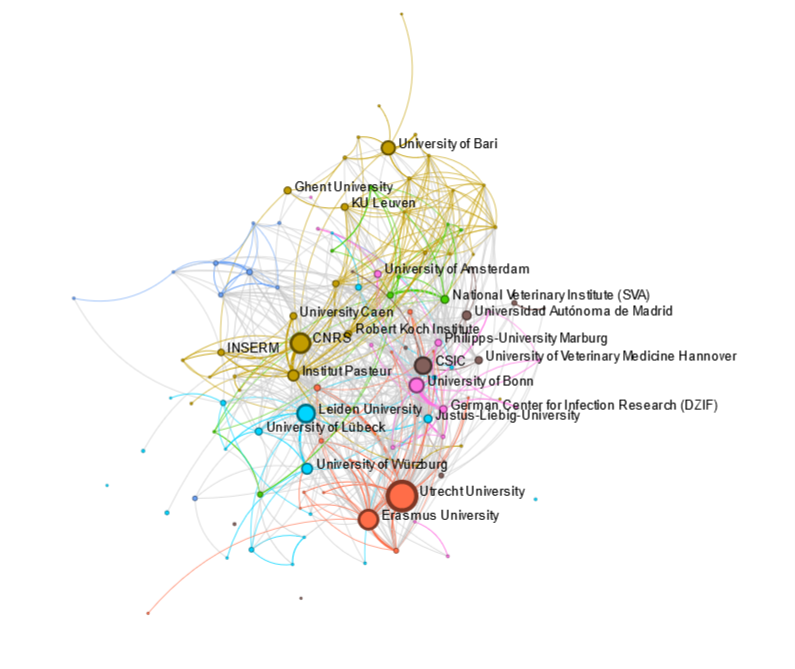
| Coronavirus - Organisations publishing in Europe
This visualisation only includes european organisations publishing on the topic. This network graph is composed of nodes (organisations) and edges.
Top 5 organisations in EU
|
Click on the image to go to the visualisation |
||||||||||||
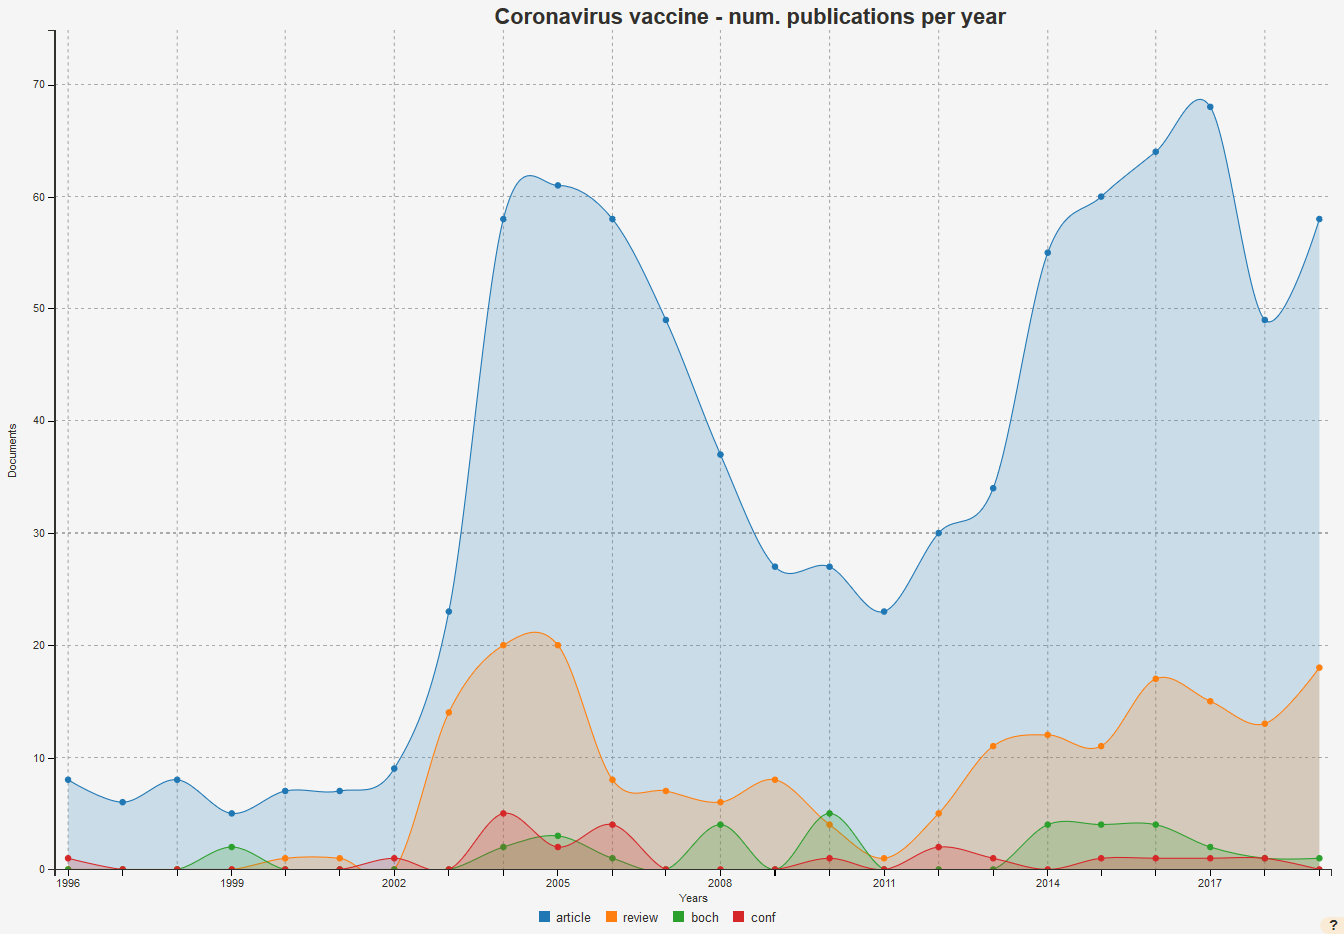
| Coronavirus Vaccines - Number of scientific publications per year
This visualisation represents the number of new scientific publications related to the topic of coronavirus vaccines by year. The number of publications is much lower but the same trends is observed: 2 increases of peer-reviewed publications, corresponding to the SRAS and MERS outbreaks respectively in 2003 and 2012.
|
Click on the image to go to the visualisation |
||||||||||||
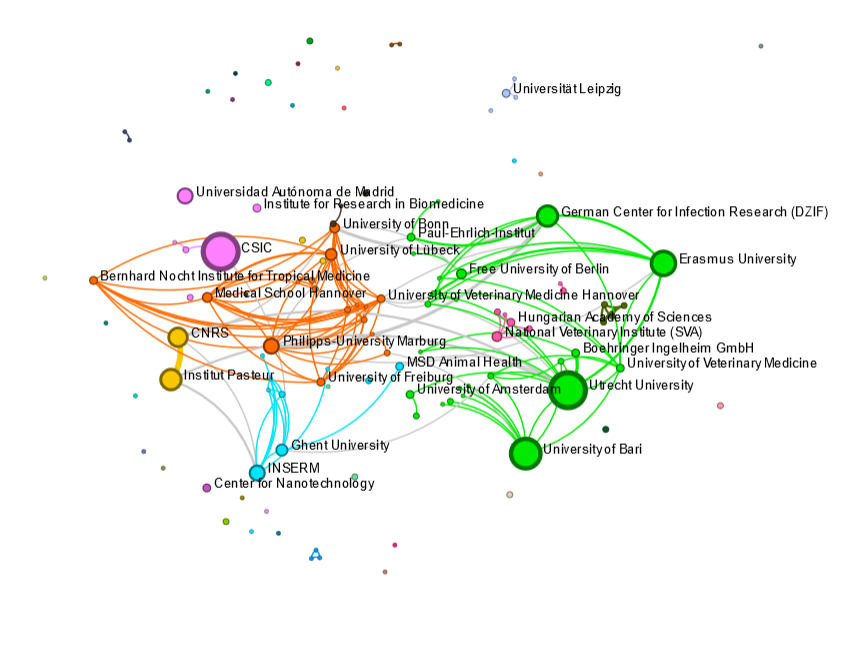
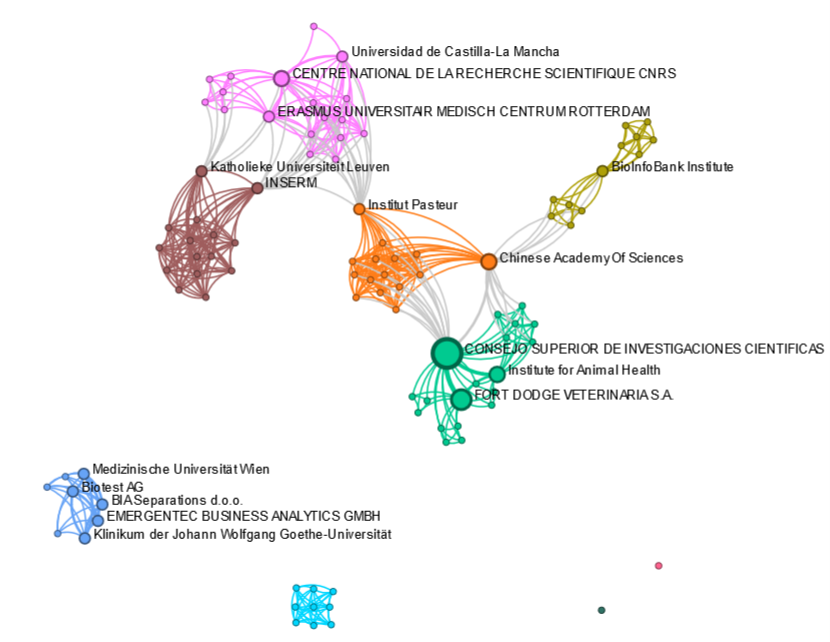
| Coronavirus Vaccines - Organisations in Europe
This visualisation only includes european organisations publishing on the topic. Several communities with few links between themselves were detected: the Utrecht University with Eramus University and University of Bari; CNRS and Institut Pasteur, Philipps University of Marburg and Hannover Medical School and the CSIC more isolated. Top 5 organisations in EU
|
Click on the image to go to the visualisation |
||||||||||||
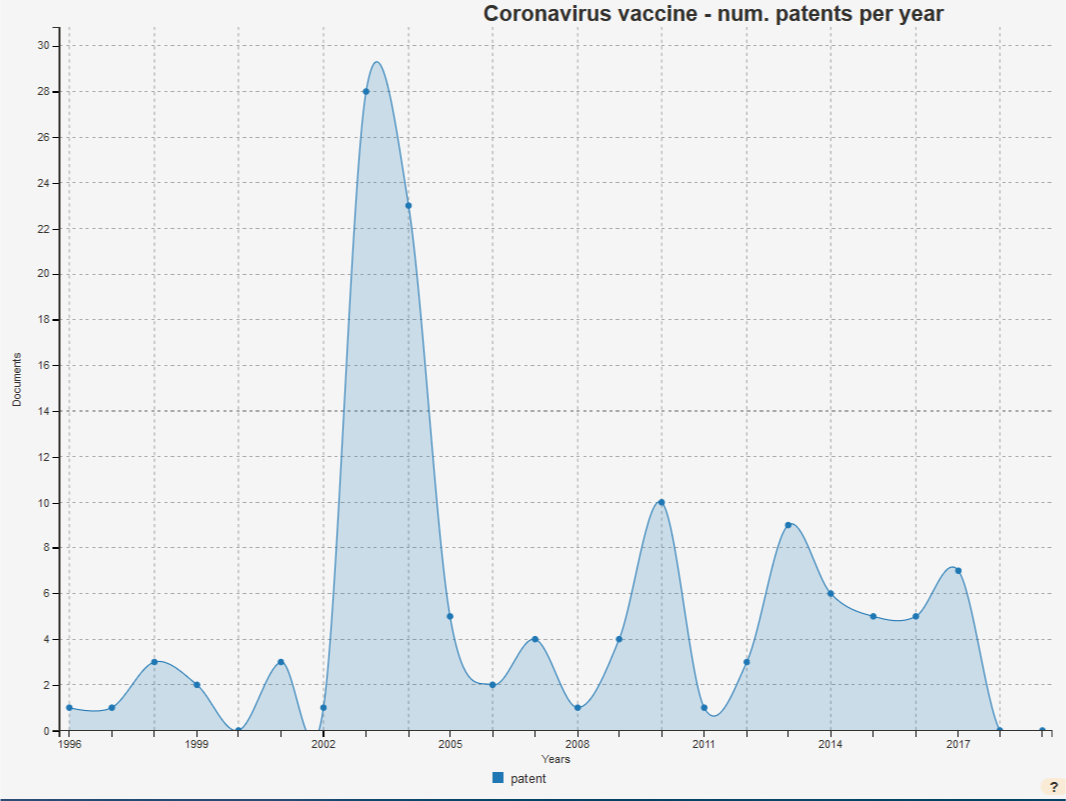
| Patents on Coronavirus vaccines - Number of patents per year
This visualisation reflects the number of patent families per year on the topic. The year refers to the priority year of the patent. The drop in 2018 and 2019 is inherent to patent systems and is just due to a delay in the data. The number of patents per year seems quite unstable, with some peaks corresponding again to 2003 and 2012. |
Click on the image to go to the visualisation |
||||||||||||
| Patents on Coronavirus vaccines - Applicant country distribution
This visualisation shows in a map the countries of origin of the patent applicants of patents with more than 3 family members. Most of the extended patents come from organisations from the EU and the US. When considering all patents, most of them are registered by organisations from China, the US, the EU and Russia. See the map distribution for all the patents. |

Click on the image to go to the visualisation |
||||||||||||
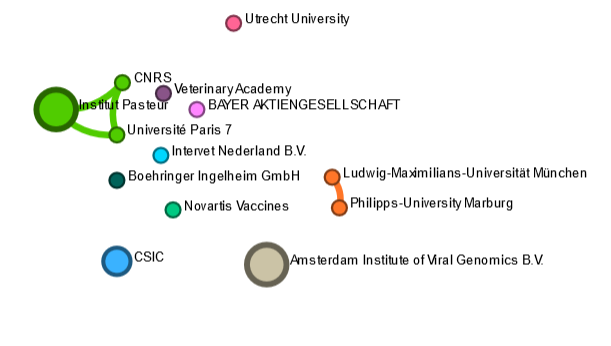
| Patents on Coronavirus vaccines - European organisations
This visualisation only includes european organisations patenting on the topic. We observe some of the same organisations than in the scientific publications. As expected, there is very little co-patenting. Top 5 organisations in EU
|
Click on the image to go to the visualisation |
||||||||||||
| Coronavirus - EU projects
This visualisation shows the number of granted EU projects. Not many european projects have been granted in this topic. In the latest years, only one project per year or less started. |

Click on the image to go to the visualisation |
||||||||||||
| Coronavirus - Beneficiaries of EU projects
This visualisation includes all the organisations beneficiaries of the projects on the topic. Some beneficiaries have a central role and participated to several projects while most of the other organisations only participated in one project. Top 5 beneficiaries
|
Click on the image to go to the visualisation |
| Originally Published | Last Updated | 21 Apr 2020 | 01 Dec 2020 |
| Knowledge service | Metadata | Text Mining |