A well designed graph can speak louder than words...
Presenting a composite indicator is not a trivial issue. Composite indicators must be able to communicate a picture to decision-makers and other end-users quickly and accurately. Visual models of composite indicators can provide signals, e.g., of problematic areas that require policy intervention. Graphical representation of composite indicators should provide clear messages, without obscuring individual data points.There are interesting ways to display and visualise composite indicators from simple tabular tools to more complicated multi-dimensional graphics and interactive software. Some examples are given below.
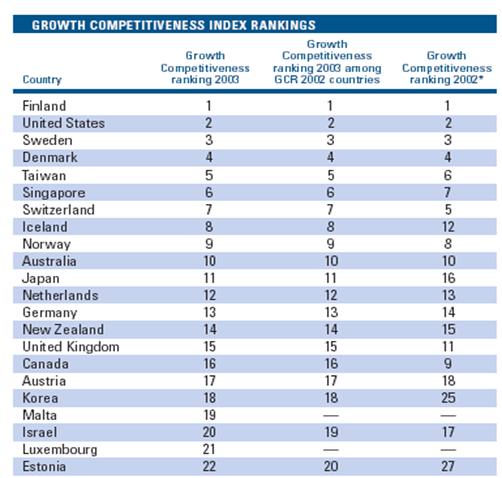
Tabular presentation of composite indicator

A tabular format is the simplest presentation where the composite indicator is presented for each country as a table of values. Usually countries are displayed in descending ranking order. Rankings can be used to track changes in country performance over time.
While tables are a comprehensive approach for displaying results, it may not be visually appealing and too detailed. However, it can be adapted to show targeted information for sets of countries grouped by geographic location, GDP, etc.
Bar chart presentation of composite indicator

@U.K. 2004
Composite indicators can be expressed via a simple bar chart. The countries are on the vertical axis and the values of the composite on the horizontal axis. The top bar indicates the average performance of all countries and enables the reader to identify how a country is performing vis-à-vis the average.
The underlying sub-indicators can also be displayed on a bar chart. The use of colours can make the graph more visually appealing and highlight the countries performing well or not so well, growing or not growing, etc. The top bar can be thought as a target to be reached by countries.
Line chart presentation of composite indicator

@OECD, 2004
Line charts can be used to show performance across time. A number of lines are usually superimposed in the same chart to allow comparison between countries. Performance can be displayed e.g., using a) absolute levels, b) absolute growth rates, e.g., in percentage points with respect to the previous year or a number of past years, c) indexed levels and d) indexed growth rates.
When indexed, the values of the composite indicator are linearly transformed so that their indexed value at a given year is 100 (or 1).
Dynamic model presentation of composite indicator

@ARUP, 2004
More complicated visualisation techniques for composites can also be used, although they may only give a snapshot of performance at a particular time.
For example, the Sustainable Project Appraisal Routine (SPeAR) is a dynamic presentation based on a four-quadrant model that structures the issues of sustainability into a framework from which an appraisal of performance can be undertaken. The outcome of the SPeAR assessment reflects the utilisation of an unweighted indicator set, based on a set of core sectors and indicators that have been derived from the literature on sustainability.
The appraisal is based on the performance of each indicator against a scale of best and worst cases. Each indicator scenario is aggregated into the relevant sector and the average performance of each sector is then transferred onto the SPeAR diagram. The transparent methodology behind the SPeAR diagram ensures that all scoring decisions are fully traceable.
Software presentation of composite indicator

@EU, 2004
Similarly, the Dashboard of Sustainability is a software representation of composite indicators which allows the presentation of complex relationships between economic, social and environmental issues in a communicative format. The Dashboard includes maps of all continents and can be developed using one’s own data set. It can help answer typical questions such as:
- what is the situation of a country compared to others?
- what are the specific strengths and weaknesses of a continent/country?
- how are certain indicators linked to each other?
Trend diagram of composite indicator

@EU, 2004
Trends in country performance as revealed through a composite indicator can be presented through trend diagrams. When a composite indicator is available for a set of countries for at least two different time points, changes or growth rates can be depicted.
For example, the EU Summary Innovation Index is used to track relative performance of European countries on innovation indicators. Overall country trends are reported on the X-axis and levels are given on the Y-axis. The horizontal axis gives the EU average value and the vertical axis gives the EU trend. The two axes divide the area into four quadrants. Countries in the upper quadrant are “moving ahead”, because both their value and their trend are above the EU average. Countries in the bottom left quadrant are “falling further behind” because they are below the EU average for both variables.
| Originally Published | Last Updated | 21 Apr 2018 | 01 Dec 2020 |
| Knowledge service | Metadata | Composite Indicators |
