About
COINr is a package (an extension) of the R language, developed by the European Commission’s Competence Centre for Composite Indicators and Scoreboards. R is a popular open-source programming language that focuses on statistics and data science.
COINr is an integrated development environment, offering a very wide range of features for building, analysing/auditing and visualising/presenting composite indicators. It is highly flexible and has no restrictions on numbers of indicators, aggregation levels, and so on. However, being an R package you will need to be familiar with R (or prepared to learn) to be able to use it.
Why COINr
There are many ways to build a composite indicator, and the COIN Tool offers an excellent solution for Excel users. However being built in Excel, the COIN Tool has limitations on the structure of the index, the number of countries/units that can be assessed, the number of indicators, and the methodological options.
COINr offers a solution for those who are willing to work in R and who want to build composite indicators with more flexibility, depth and reproducibility. In particular COINr offers the following features and advantages:
- No limits on index structure, numbers of units, indicators etc.
- Very wide range of methodological options index construction, including for imputation, denomination, data treatment, normalisation, aggregation.
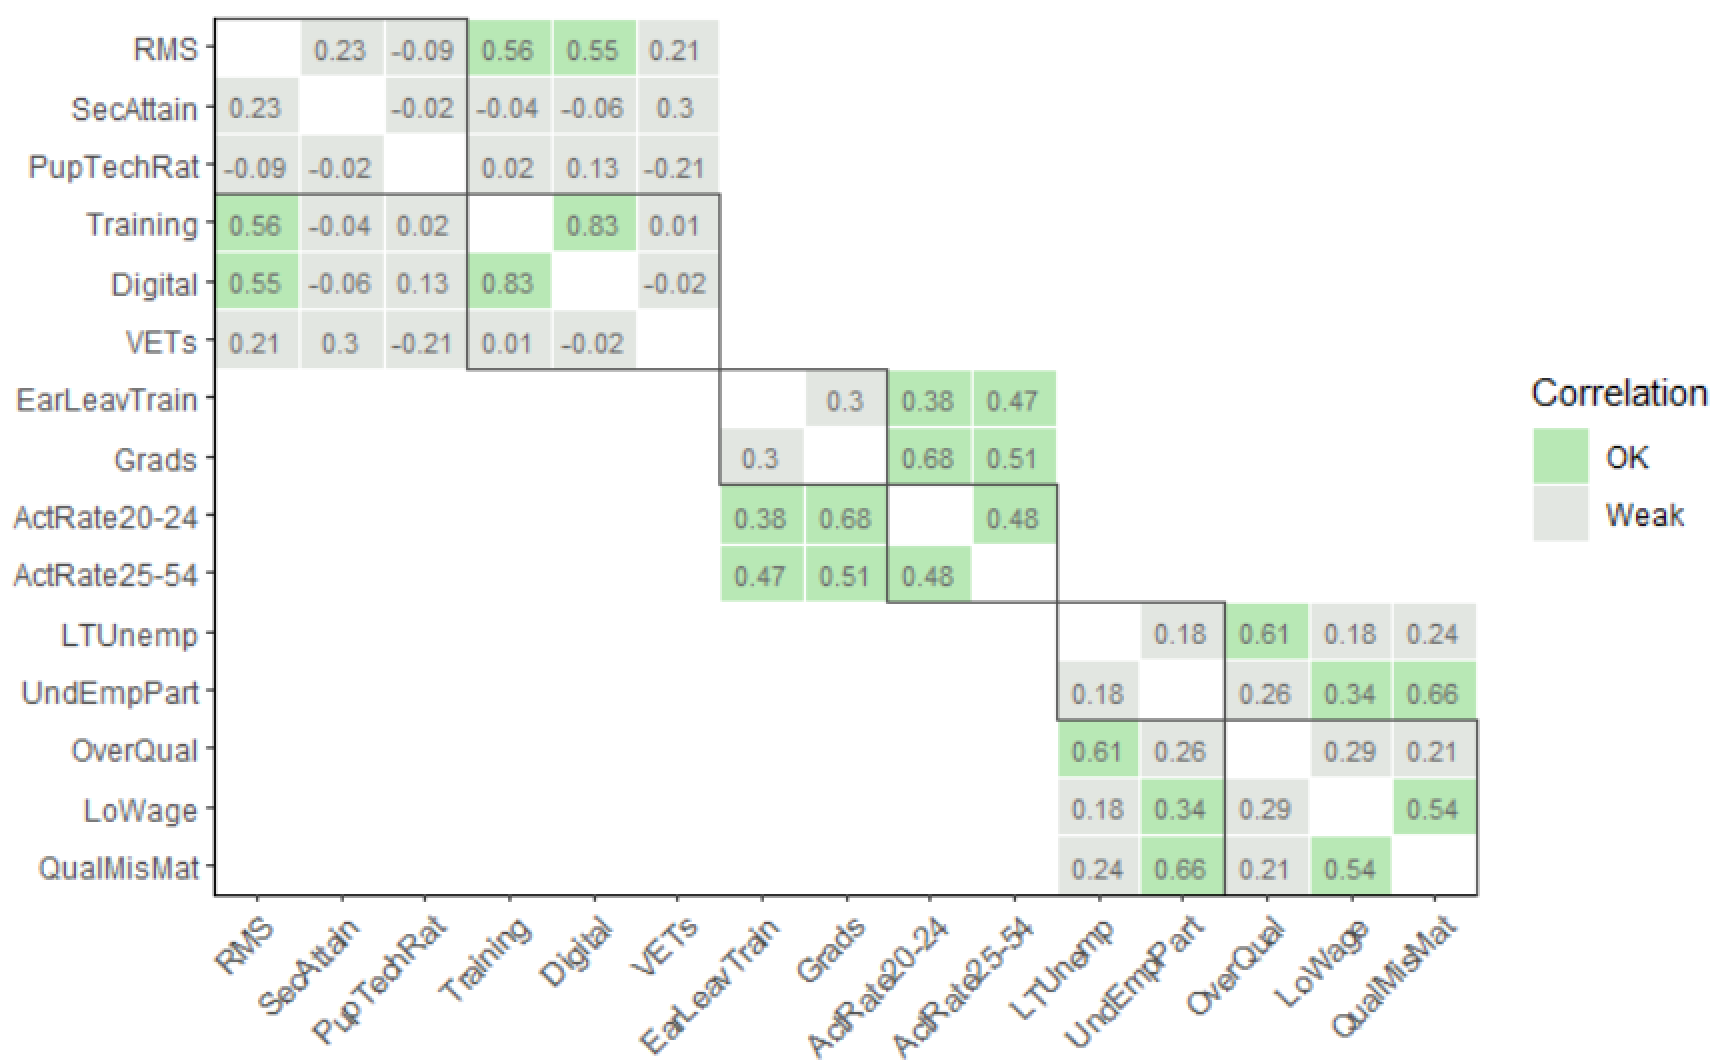
- Advanced statistical tools including indicator statistics, correlation analysis, principal component analysis, global sensitivity analysis.
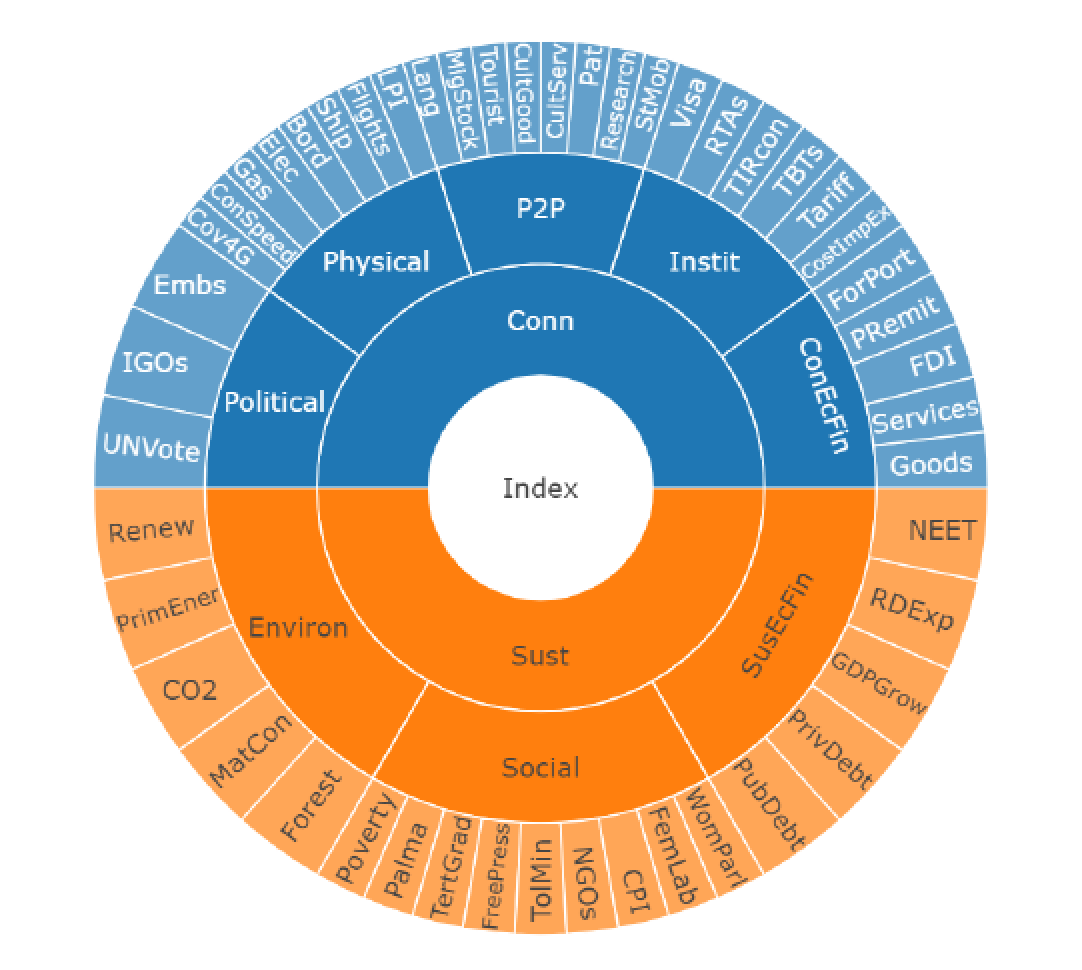
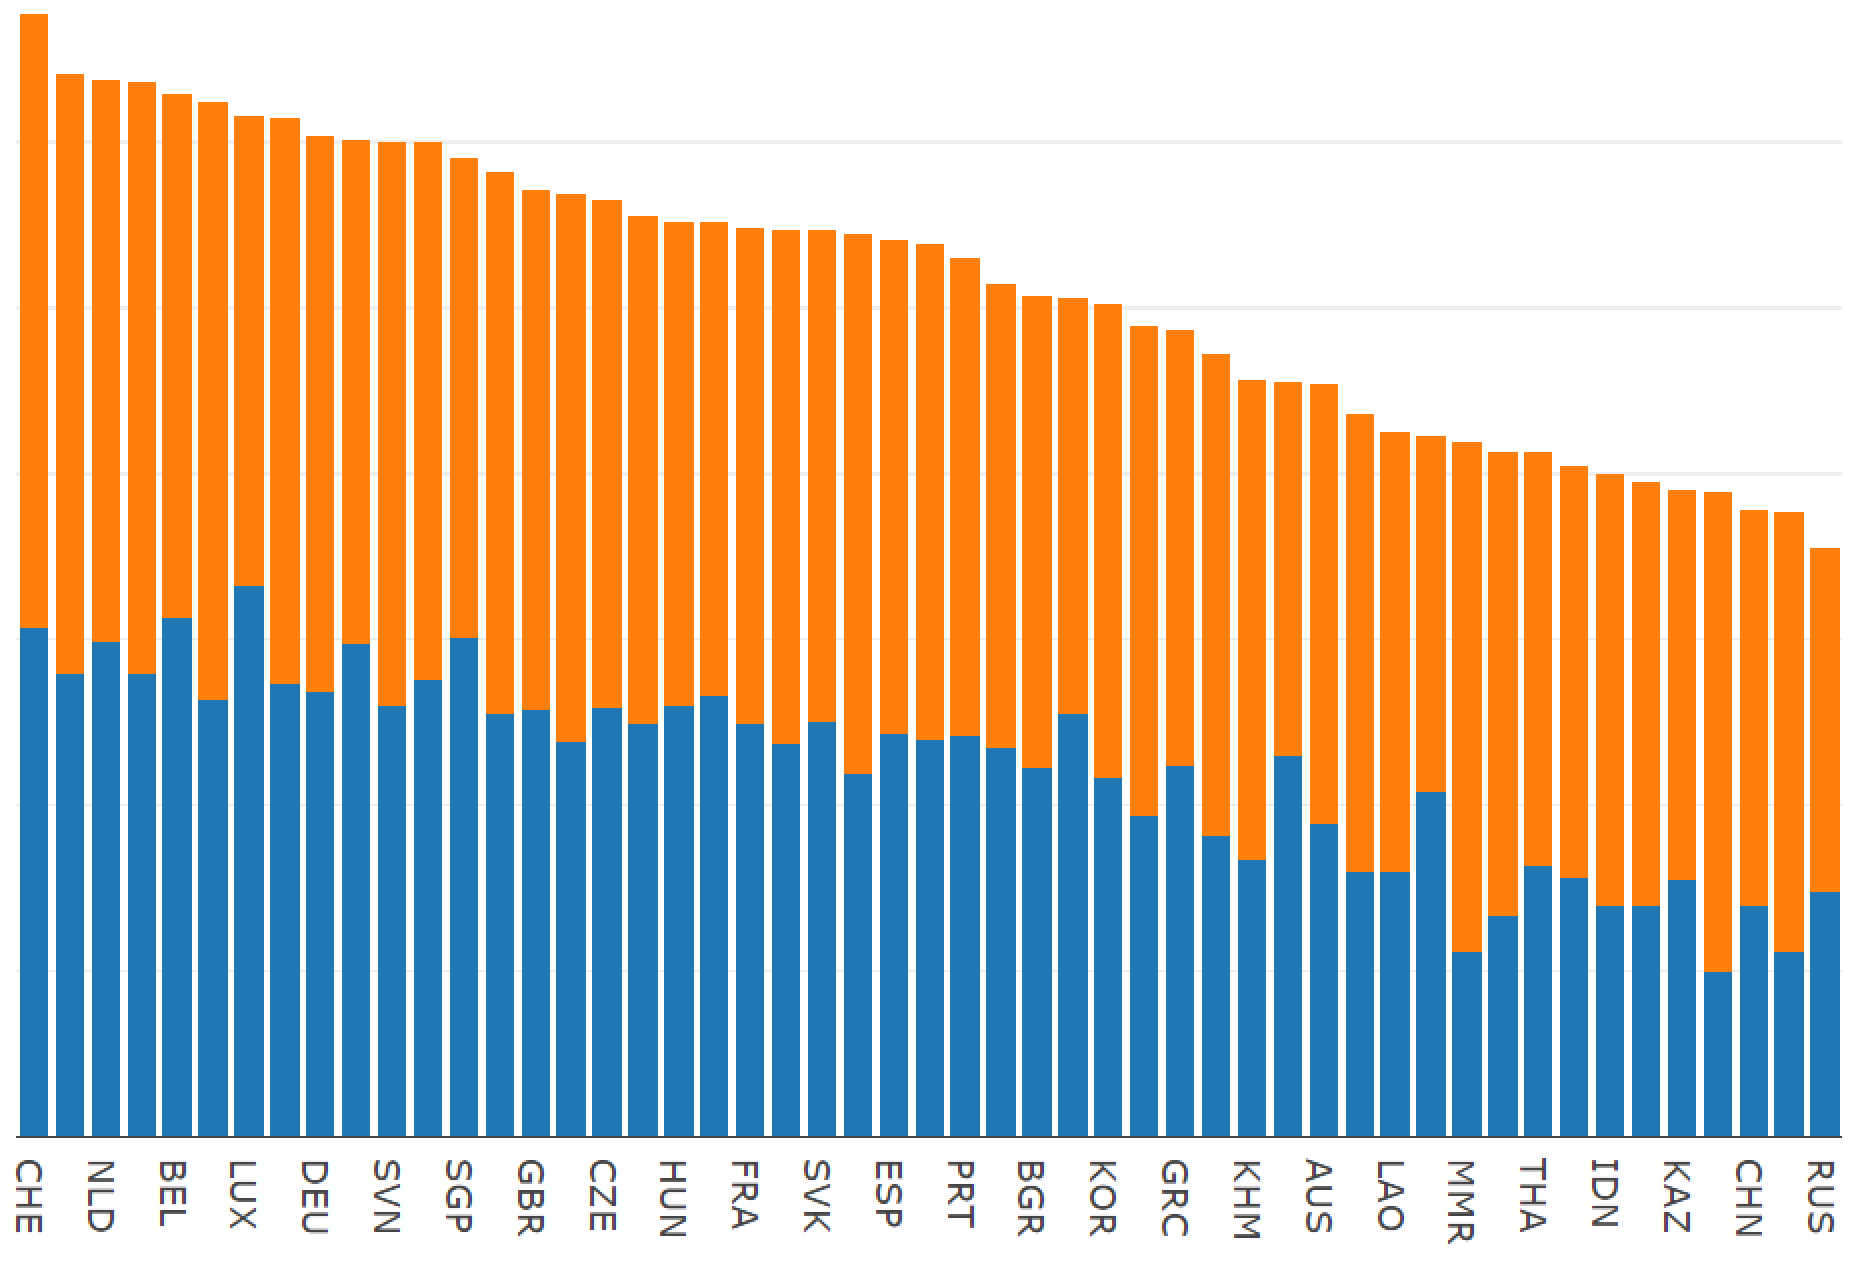
- Many visualisation options, including statistical plots, bar charts, maps, radar charts, correlation plots and more.
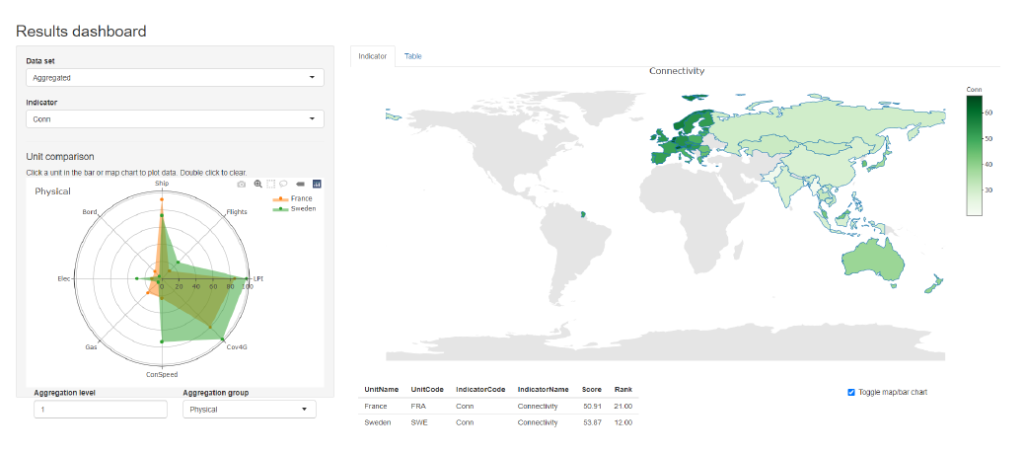
- Includes three interactive apps for results viewing and analysis.
- Indexes can be easily duplicated, adjusted and compared, allowing easy “what-if” experiments, e.g. adding/removing indicators, trying alternative methodologies.
- End-to-end transparency and reproducibility – the entire process can be recorded using R Markdown or a script.
- Automatically generate “country reports” based on a template, for all countries, with a single command.
- Fast import from the COIN Tool, fast export of results and analysis to Excel.
- Possibility to link to advanced statistics packages available in R – some COINr operations allow passing custom functions (e.g. aggregation, normalisation)
- Once you are familiar with COINr, it should provide a fast and accurate development environment.
Since both R and COINr are open-source, they are completely free, as are all of the other packages in R.
 |
 |
 |
COINr - Visual Data examples
Install
COINr needs R to run. If you don’t have R, install it here.
Not strictly necessary, but recommended, is R Studio, which is a graphical interface for R. COINr will run without this, but R Studio generally makes life easier in R. Install that here.
Once R is installed, you can install COINr using the following command (or by searching for it in the “install packages” list in R Studio)
install.packages("COINr")
You can also install the development version from GitHub, which will have the most recent updates and bug fixes to the package. First, install the 'devtools' package if you don't already have it, then run:
devtools::install_github("bluefoxr/COINr")
This should directly install the package from Github, without any other steps. You may be asked to update packages. This might not be strictly necessary, so you can also try skipping this step.
Getting started
COINr needs a little reading and learning to understand properly. But once you have done that, it can be very powerful for developing composite indicators.
A good place to get started is COINr's "Overview" vignette. Try vignette(package = "COINr").
The most thorough documentation is available at COINr's online documentation, which is a little long but quite comprehensive. If you want to dive straight in, have a look in particular at:
The Example on building a composite indicator.
The Example on analysing a composite indicator.
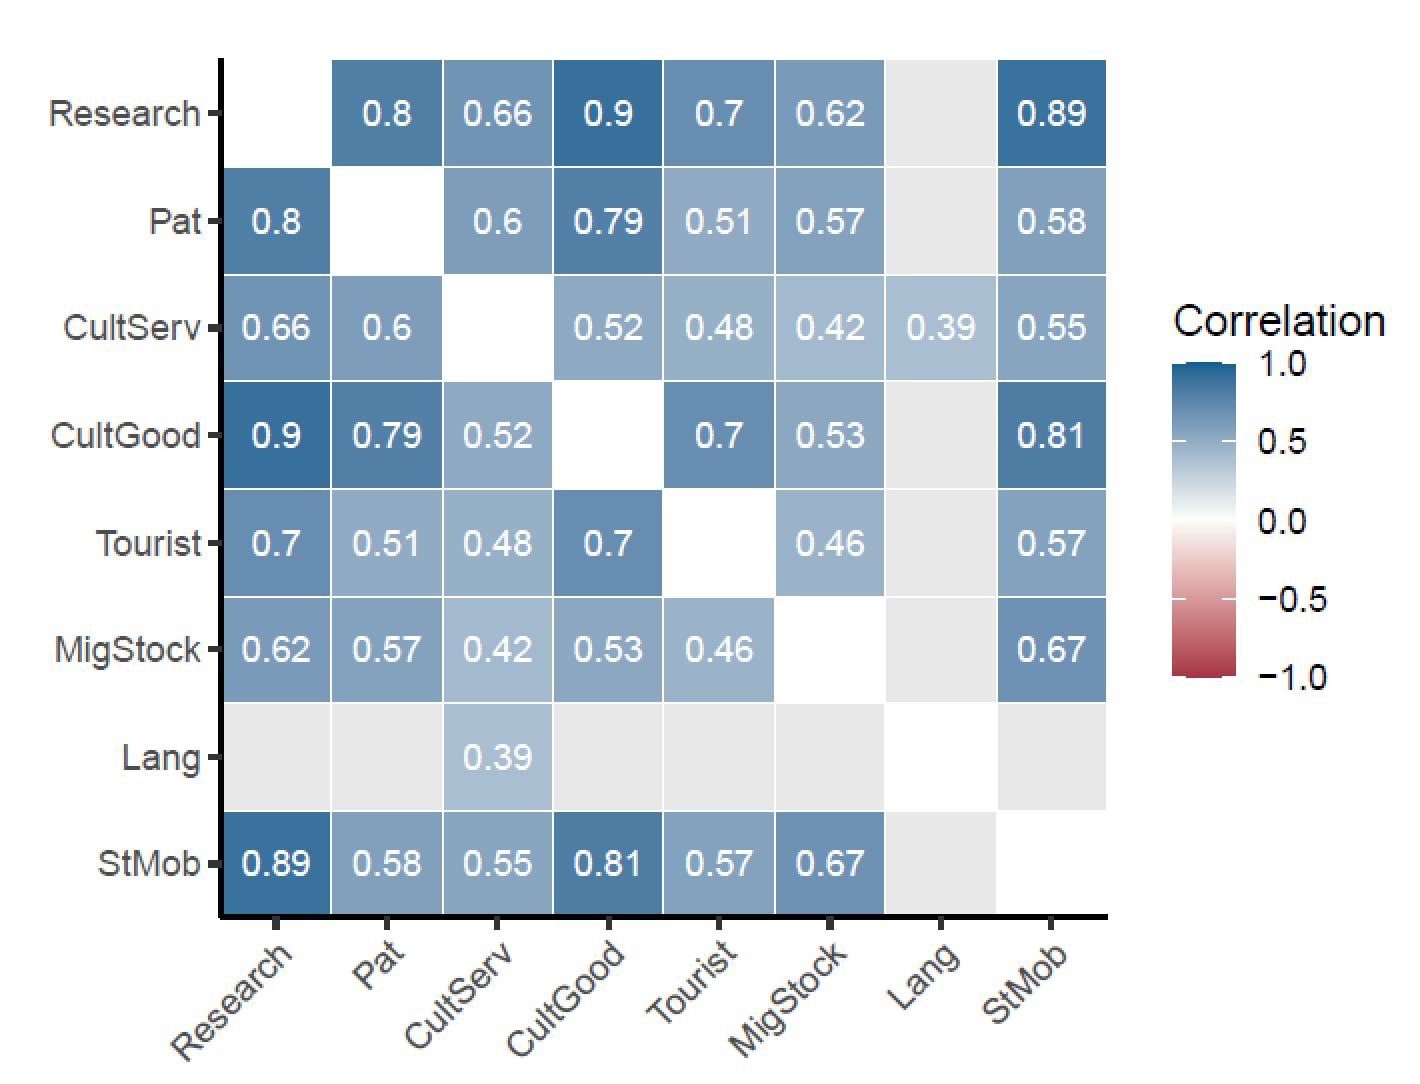 |
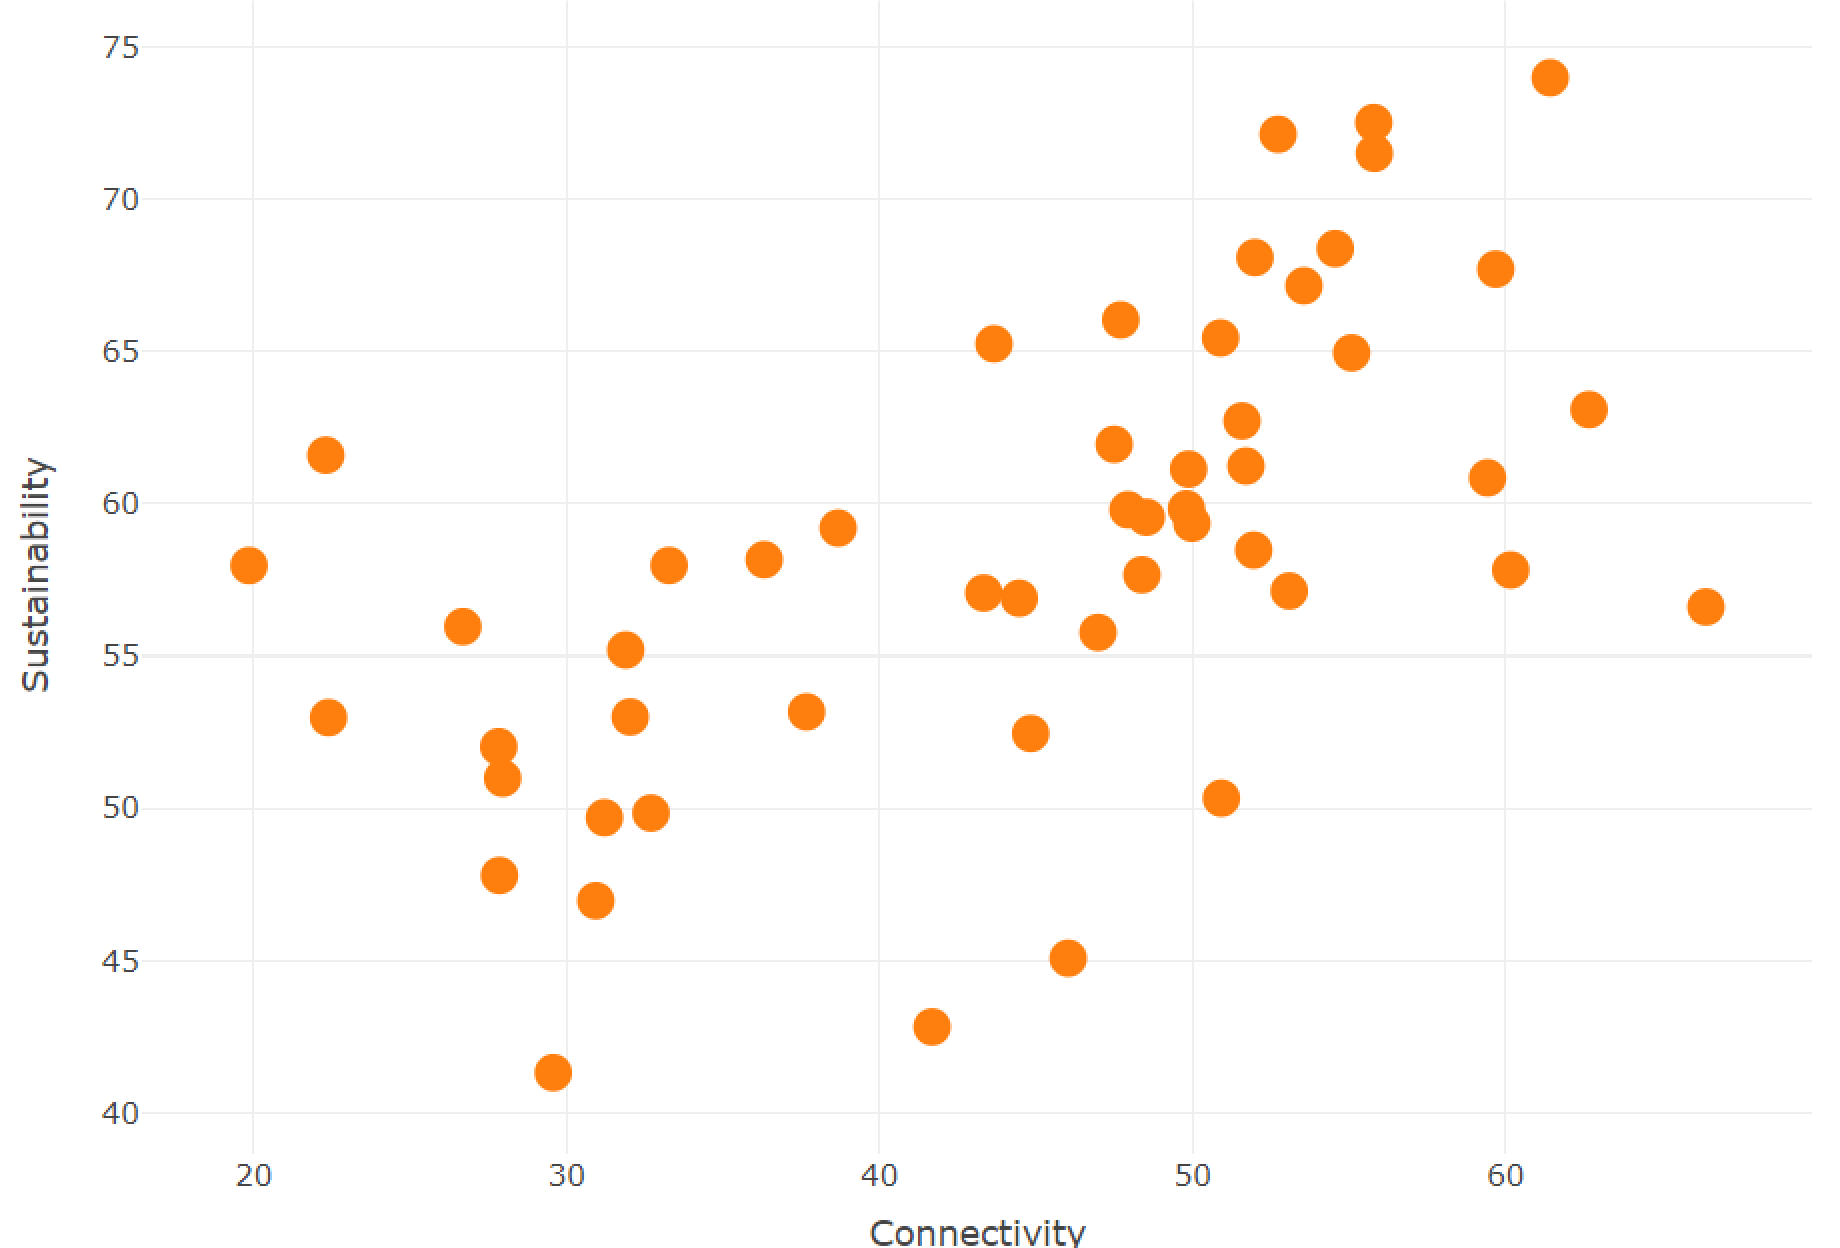 |
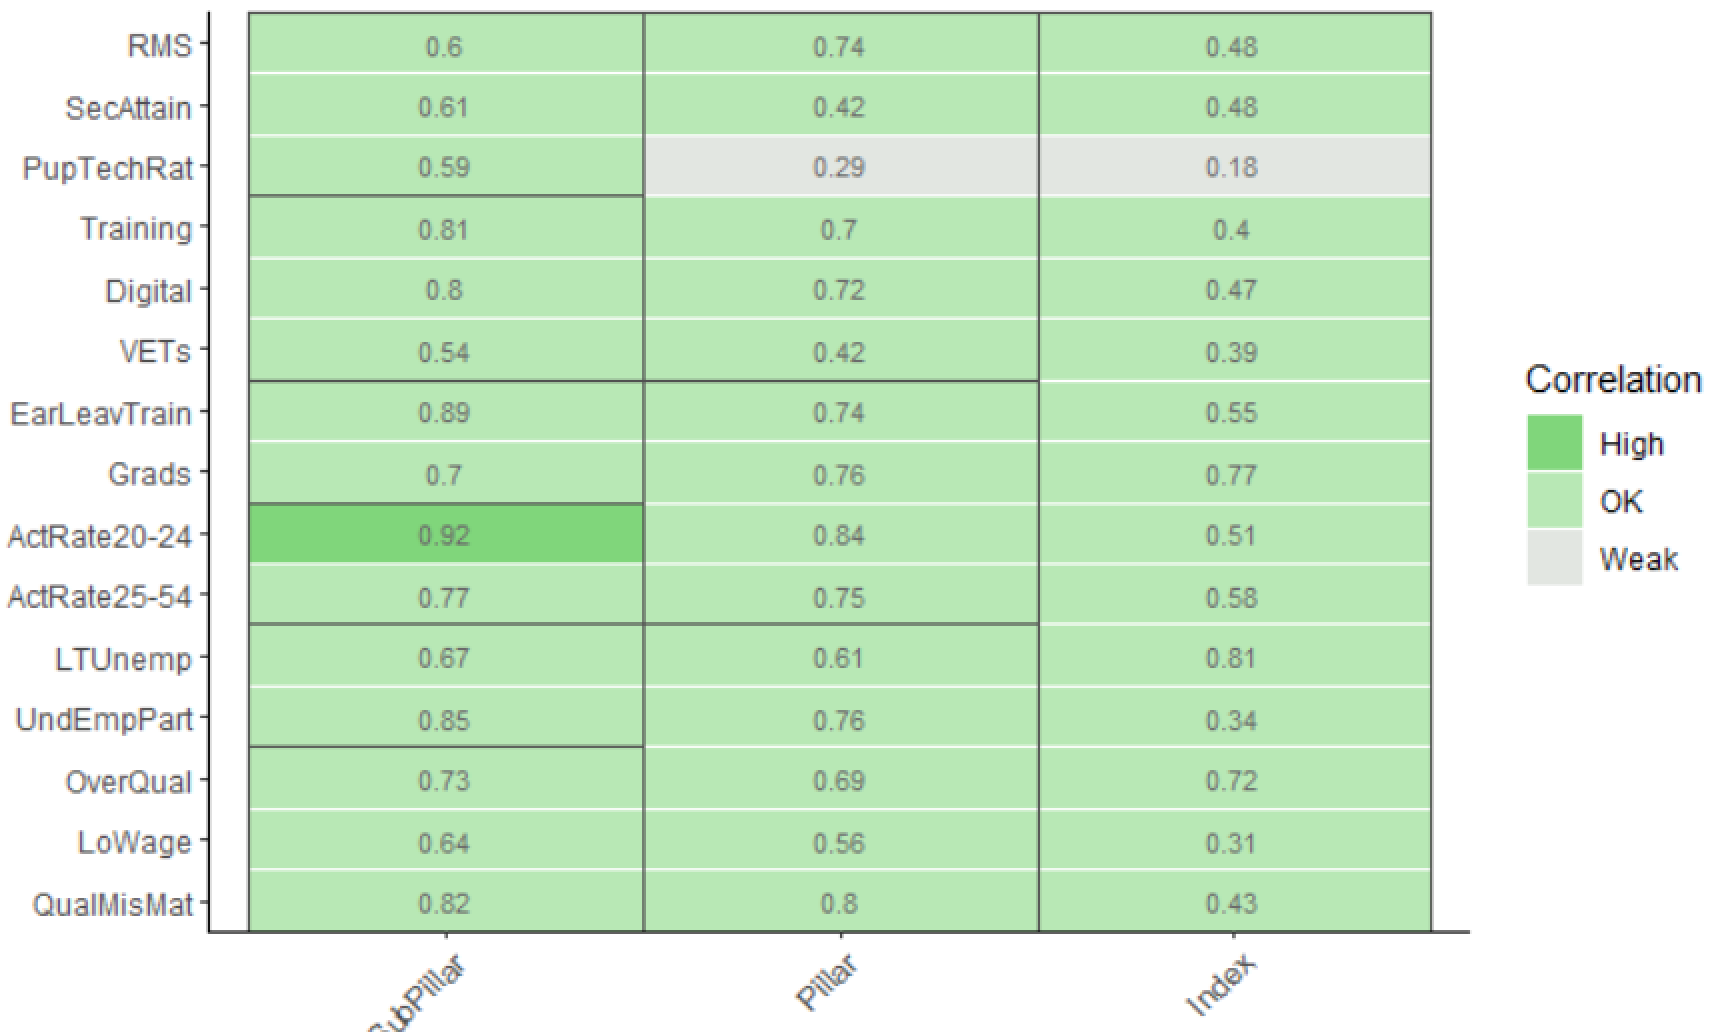 |
COINr - Visual Data examples
Further resources
COINr help is available in a number of places. For help on individual functions, run in R:
?function_name
E.g. to see how the normalisation function works, run:
?normalise
The full function documentation is also available here as a pdf.
General information about COINr, its dependencies, and zip downloads can be found at the COINr CRAN page.
Also at the same page is a link to the COINr vignette, which is a descriptive document giving an overview of COINr features, with commands, graphics and accompanying explanation. This may be a good starting point for newcomers.
The most in-depth documentation on COINr is available in an online book. This also includes some tips about composite indicator construction, and some explanation of the methodology used in COINr. This book is periodically updated, but may not be fully up-to-date with the latest additions to the package.
Finally, the source code for COINr is found on GitHub here. This is also the place to flag issues and bugs, suggest improvements, and even to collaborate on the project. This page always contains the most up-to-date version of COINr, and news on updates.
| Originally Published | Last Updated | 22 Oct 2021 | 10 Aug 2022 |
| Knowledge service | Metadata | Composite Indicators |
Share this page
