Date of event: Friday, April 1, 2022
Where: Online
Description:
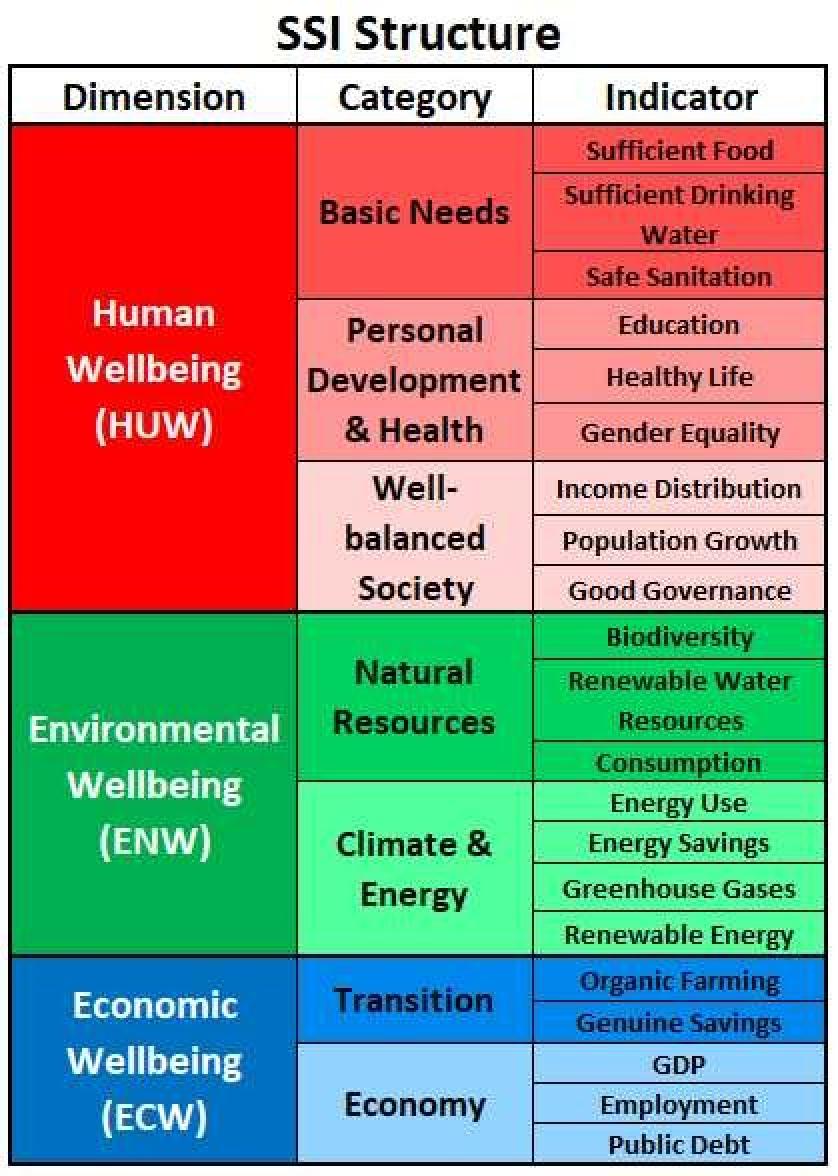
The SSI is structured along the lines of the Triple Bottom Line (TBL) of social, environmental and economic sustainability.
In the SSI-terminology this translates into Human Wellbeing (HUW), Environmental Wellbeing (ENW) and Economic Wellbeing (ECW), respectively. HUW consists of three categories which are based on nine indicators. ENW consists of two categories based on seven indicators.
Finally, ECW consists of two categories and five indicators. I. e. 21 indicators are aggregated into 7 categories, which are aggregated into 3 dimensions. All scores are given on a sustainability scale of 1(weakest) to 10 (strongest). There is no overall sustainability score combining the three dimensions.
History:
Since 2006 the SSI, developed by the Dutch Sustainable Society Foundation, published datasets bi-annually for 154 countries/territories. After TH Köln took over responsibility for further development and maintenance of the SSI, the number of countries/territories was extended to 213. In 2022, a recalculation for every year since 2000 will be published. This data collection opens up an even better opportunity for cross-sectional and longitudinal analyses.
Differentiation to other sustainability index systems The SSI is listed in the EU’s COIN list. Besides the SSI, this list contains only three other index systems covering all three sustainability pillars at once: the SDG Index, the Global Sustainable Competitiveness Index (GSCI) and the Transition Performance Index (TPI).
Compared to the SSI, the GSCI is more narrowly focused on economic competitiveness; the TPI follows a concept more akin to the SSI, but with limited scope of countries and time, leaving the SSI as the one general TBL based index consistently covering the largest number of countries over the longest time period. Furthermore, with 21 indicators it is easier to handle than the SDG and thus has a wider target group.
Societal impact:
By covering all three pillars of sustainability, the SSI allows a holistic view on sustainability aspects of the entire society and economy and fosters discussions among social (sociology, economics,
business) and natural sciences.
In education the SSI can be used for date driven awareness-raising for sustainability issues in secondary and tertiary education, e. g. as a baseline for exercises of data handling and analysis, for empirical research teaching in sustainability issues etc. Because the SSI has a quite easy understandable and clear structure it is especially suitable for inexperienced users.
For companies and businesses, the SSI can be applied in international strategic planning and risk management, e. g. to measure supply chain sustainability, to deliver a basis for decision-making in country specific risk assessment etc. Again, because of the clear structure of the SSI it is easy for the companies to comprehend the system and apply it quickly and easily. Just to name one explicit example: Bosch had asked for SSI data in order to decide about the reliability of their supplier countries.
In research, the SSI supports the analysis of TBL-processes and -structures, e. g. it is used in empirical studies about consumer behavior and sustainability, in the identification of additional social and environmental sustainability categories etc.
The SSI can support the UN and its organizations as well as initiatives and NGOs to drive their own transformation as well as the transformation in its maintained area.
In connection with development cooperation, the SSI can initiate discussions about new trends of the development cooperation and how to implement them in a sustainable way.
By observing the Distance to Best Performer, which is shown on our website, politicians can find out who the leader in a certain sustainability area is and try to follow it.
Last but not least, because the SSI opens up the opportunity of time series analyses, it is possible to find out, which sustainability measures lead to the projected objectives and which does not.

| Originally Published | Last Updated | 10 Feb 2022 | 11 Oct 2022 |
| Knowledge service | Metadata | Composite Indicators |
