The SDGs monitoring process
The Agenda for Sustainable Development 2030 was adopted by all the UN Member States in 2015 as a call to action to end poverty and build fairer societies through partnerships, to protect the planet and to ensure that all people enjoy peace and prosperity by 2030. The Sustainable Development Goals (SDGs) are the 17 objectives outlined in this agenda and identified as essential to pursue environmentally, socially and economically sustainable development by addressing the numerous challenges the world faces today. The SDGs are characterized by a complex, yet integrated design recognizing that progress in one area will affect outcomes in other areas and acknowledging that multifaceted challenges require complex solutions. The SDGs are underpinned by a list of very concrete targets and indicators, respectively 169 targets and 231 indicators, allowing us to measure and track progress towards the achievement of these ambitious goals. The SDG monitoring process is divided into three main steps: firstly, data inputs are collected through different sources as national spatial data infrastructure, national statistics systems, Earth observations and alternative sources as big data. As a second step, this data is integrated and aggregated into indicators by National Statistics offices and lastly, it is used to report on specific SDG indicators. This multi-layered reporting system aims to provide an overview of strengths and weaknesses in performance across the SDGs, helping to identify priority areas for action within the broad 2030 Agenda.
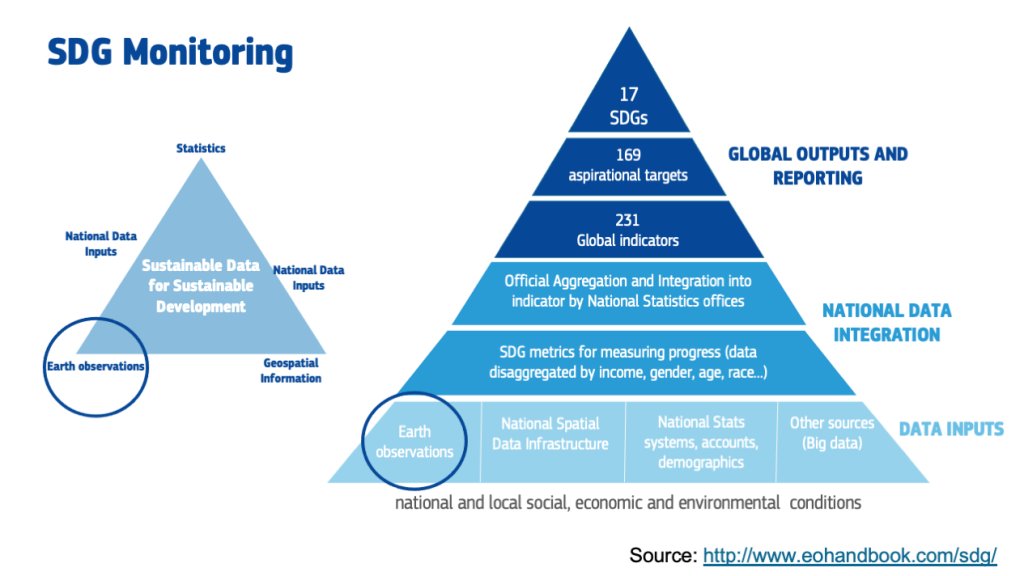
In response to the 2030 Agenda, the European Commission adopted in 2016 its Communication ‘Next steps for a sustainable European future: European action for sustainability’. The Communication announced a detailed regular monitoring of the SDGs in the EU context, which led to the establishment of the EU SDG indicator set and the launch of annual EU SDG monitoring reports.
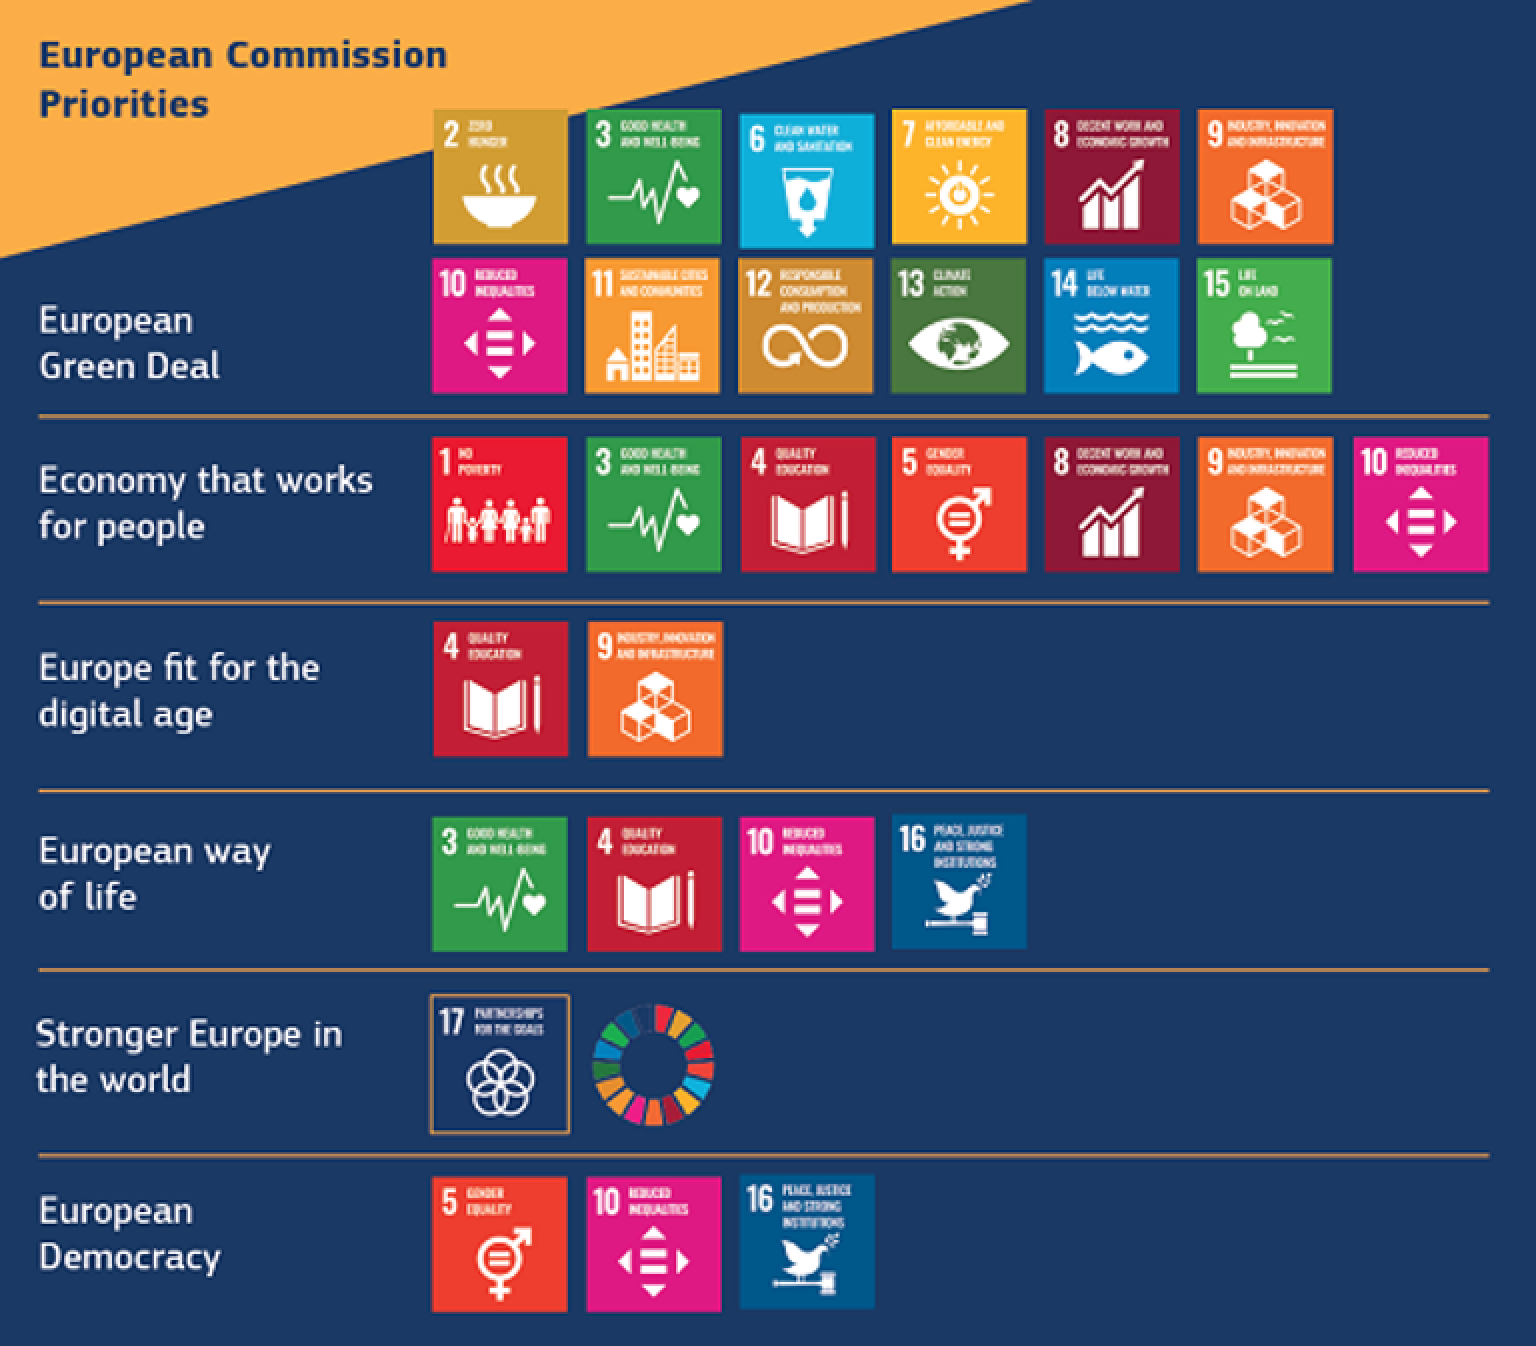
The European Commission remains committed to the 2030 Agenda. Under the leadership of President von der Leyen, the Commission has presented an ambitious policy programme to deliver on sustainability in the EU and beyond. The SDGs are mainstream in to the Commission Priorities integrating the SDGs into all Commission proposals, policies and strategies. All of the 17 SDGs feature in one or more of the six headline ambitions announced in President von der Leyen’s Political Guidelines.
On implementation, Eurostat has led the development of the reference EU indicator framework in cooperation with other Commission services and Member State organisations. The EU SDG indicator set is structured along the 17 SDGs, each SDG is covered by five or six main indicators, 65 indicators are aligned with the UN SDG indicators. The indicator set is open to regular reviews including considering the use of new data sources, such as the integration of Earth Observation data and information from Copernicus, whenever they contribute to the increased availability, quality, timeliness and disaggregation of data.
Use of EO and Copernicus in SDG monitoring
Some of the key benefits derived from the use of Earth observations for SDG monitoring are the continuous availability of observations, the availability of multi-annual time series highlighting changes, their capacity to enable stable observations and lastly, the cost-effectiveness of EOs to monitor remote areas where ground-based surveys are inaccessible. Main challenges related to the use of Earth observations-derived information (EO-derived information) for SDG monitoring are the need for better integration of this data with national statistics, which require technical capacity to analyse EOs. Such capacity, especially for developing countries, could be provided through capacity-building and access to cloud computing facilities allowing to process data online.
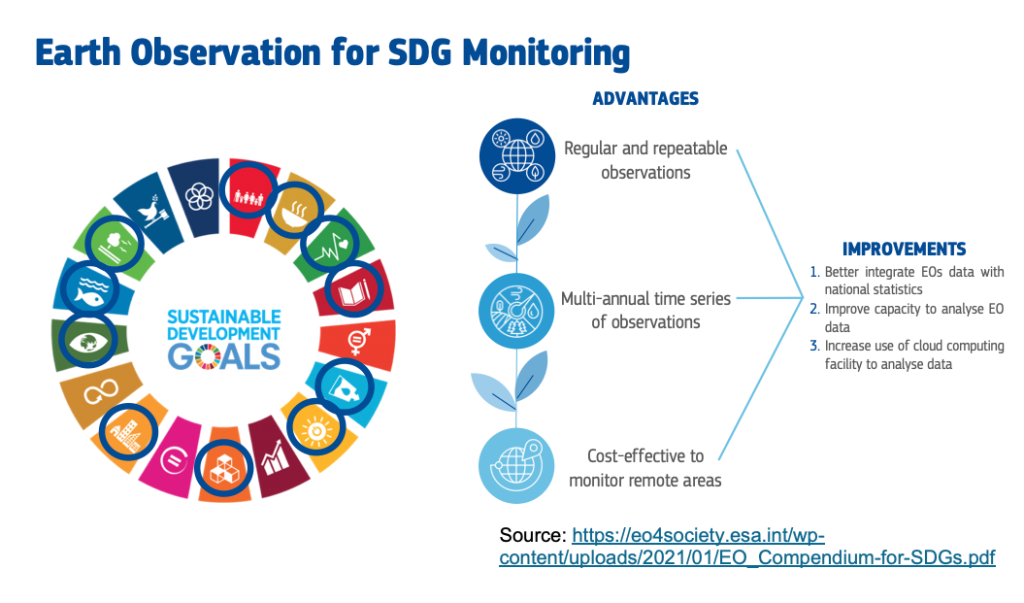
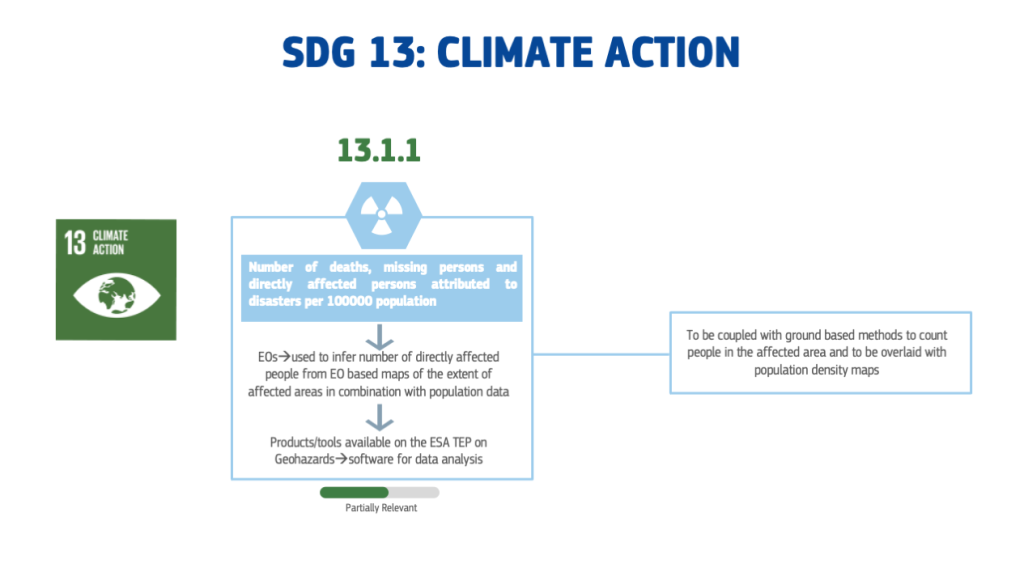
The European Union’s Space Programme and ESA contribute to the SDGs by directly supporting the achievement of many of these, including SDG 9 by maintaining the viability of Europe’s space industry through continuous innovation, but also SDGs related to health (SDG 3), agriculture (SDG2 and 15) and the environment (SDG13) through projects combining satellite telecommunications and space-based applications to monitor crop yields, air quality and disaster risks.
Some of the key datasets used in the context of SDG monitoring are developed by the Copernicus services. The Copernicus Programme has a number of specific characteristics which ensure that it is an ideal candidate for the provision of data and information for SDGs.
These characteristics can be summarised through the following 8 points which when combined make Copernicus a unique Earth Observation Programme to address these issues:
- Copernicus is by definition User and Policy Driven
- There is long-term sustained commitment to the delivery of products and Services
- The data and products are full free and open, including for redistribution
- There is a strong international dimension and incentive to establish partnerships
- The Programme is operational in data production and Service delivery
- It has a uniquely broad cross-domain product portfolio
- It is open to new needs and requirements, and evolves to address them
- As well as responsive to new technologies and research
These generic characteristics are implemented at the level of specific products and services to address the individual SDGs and their indicators.
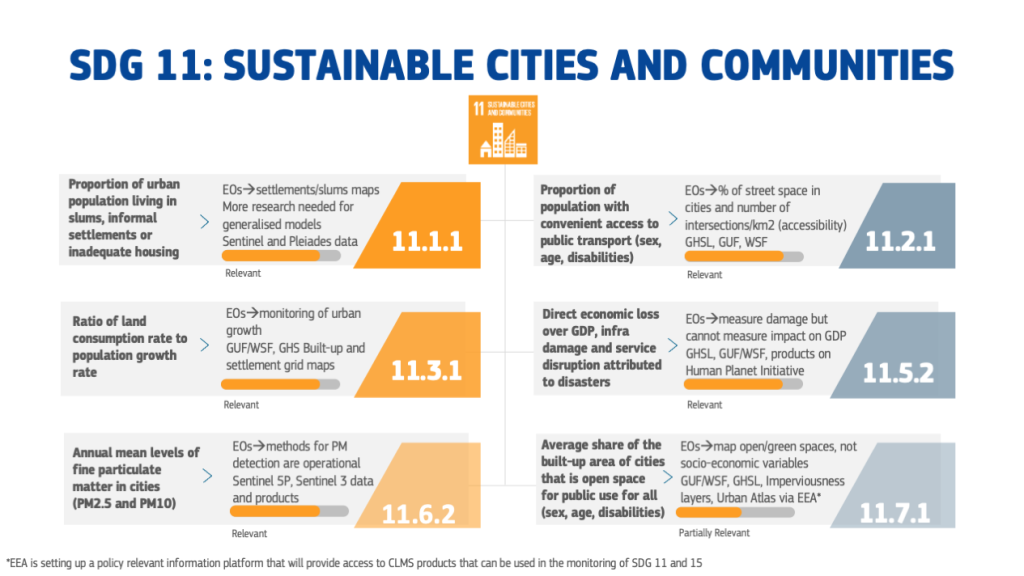
The main products used in the context of SDG reporting to map human presence are the Global Human Settlement Layers (GHSL), the World Settlement Footprint (WSF) and the Global Urban Footprint (GUF). While the last two are produced by the German Aerospace Centre and provide a global mapping of built-up areas, the GHSL, developed by the Joint Research Centre (JRC), provides global information on human presence on the planet over time, in the form of built-up maps, population density maps and settlement maps. The Imperviousness Layers from the Copernicus Land Monitoring Service capture the percentage change of soil sealing using Sentinel data; among the input layers, the European Settlement Map (ESM 2012) is based on the GHSL methodology.
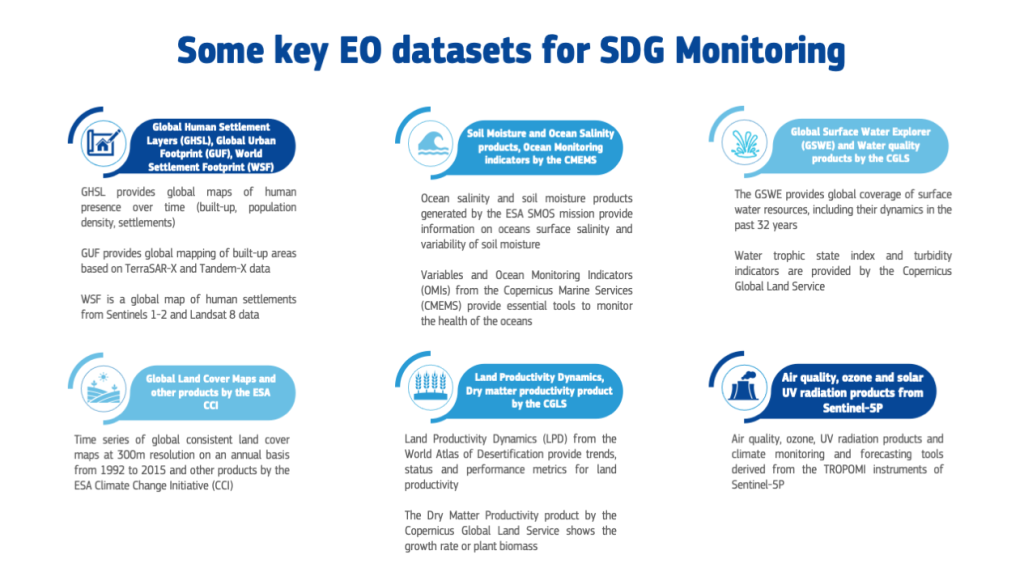
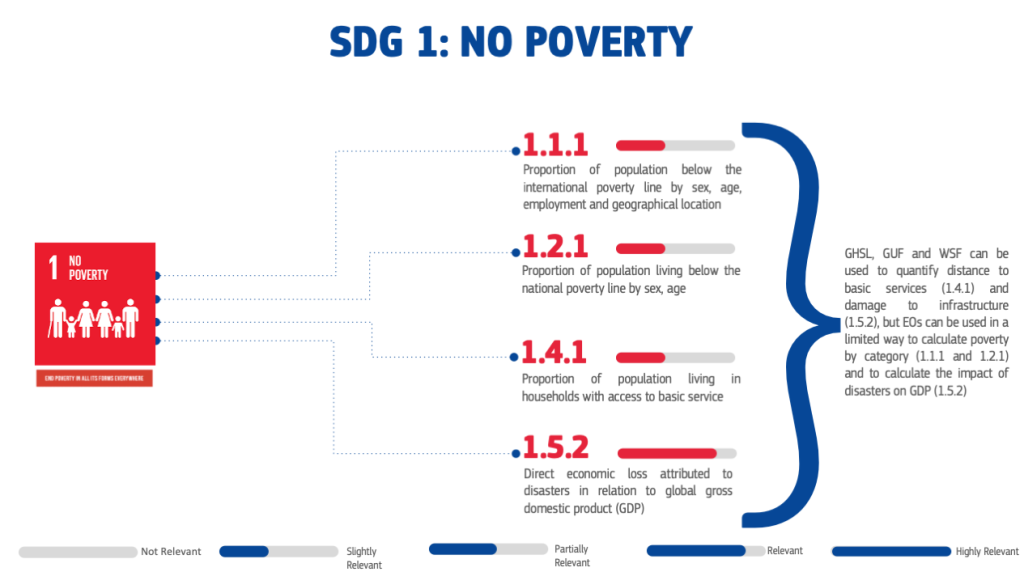
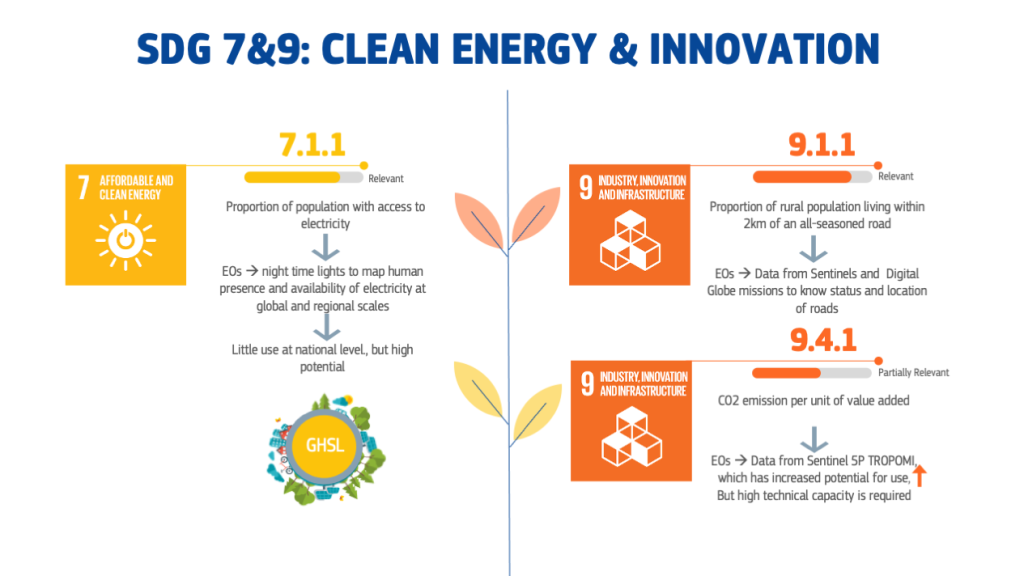
The GHSL, GUF and WSF are used to monitor SDG 1 on poverty eradication in order to quantify distance of households from basic services and the direct damage to infrastructures for the estimation of economic loss due to disasters (indicators 1.4.1 and 1.5.2), and SDG 11 (Sustainable Cities and Communities) where, together with the Imperviousness Layers, these products can provide information for example on population living in slums, on access to public transport, on the areas of cities that is open space for public use or on the ratio of land consumption rate over population growth rate. The GHSL is particularly useful for the monitoring of SDG 6 (Clean Water and Sanitation) to quantify population with access to safely managed drinking water services (indicator 6.1.1) and SDG 7 (Affordable and Clean Energy), to assess the proportion of population with access to electricity (indicator 7.1.1).
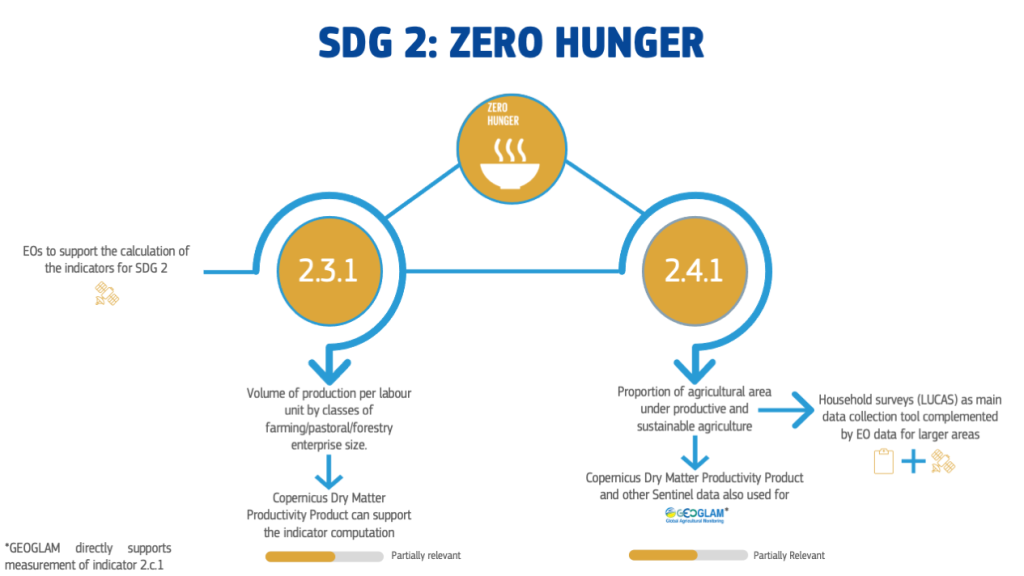
Another product from the Copernicus Global Land Service used to monitor indicators under SDG 2 (zero hunger) such as the volume of production per labour unit by classes of enterprise sizes (2.3.1) is the Dry Matter Productivity Map. Dry Matter productivity maps are also used by initiatives such as GEOGLAM to estimate the proportion of agricultural area under productive and sustainable agriculture (indicator 2.4.1).
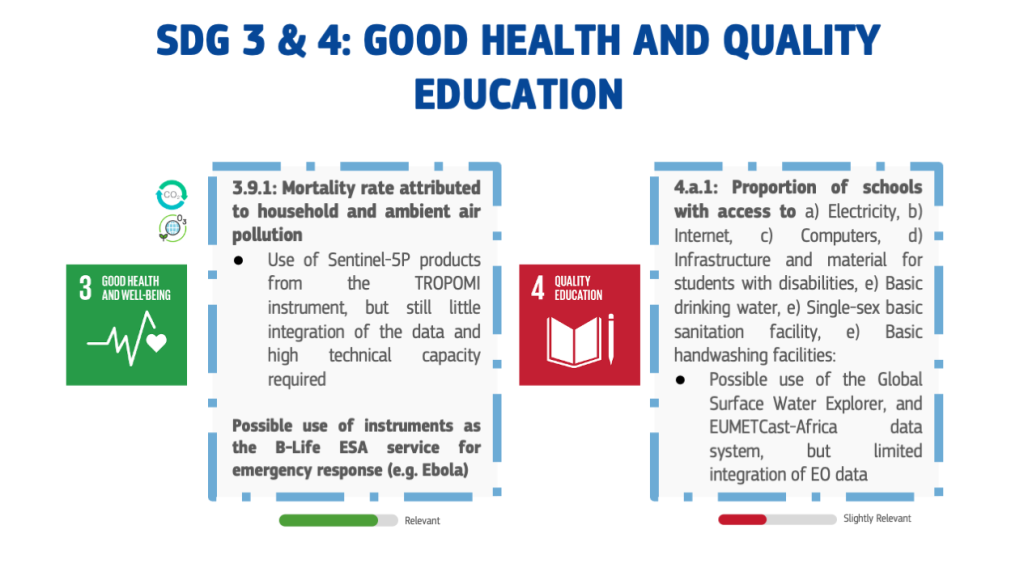
Copernicus Sentinel-5P TROPOMI instrument can provide useful atmospheric data for products on air quality, ozone and UV radiation, that can be used to support the assessment of the mortality rate attributed to household and ambient air pollution (indicator 3.9.1 under SDG 3 - Good health and well-being), CO2 emissions per unit of added-value (indicator 9.4.1 under SDG 9 - Industry, innovation and infrastructure), and the annual mean levels of particulate matter in cities (indicator 11.6.2 under SDG 11 - Sustainable cities and communities).
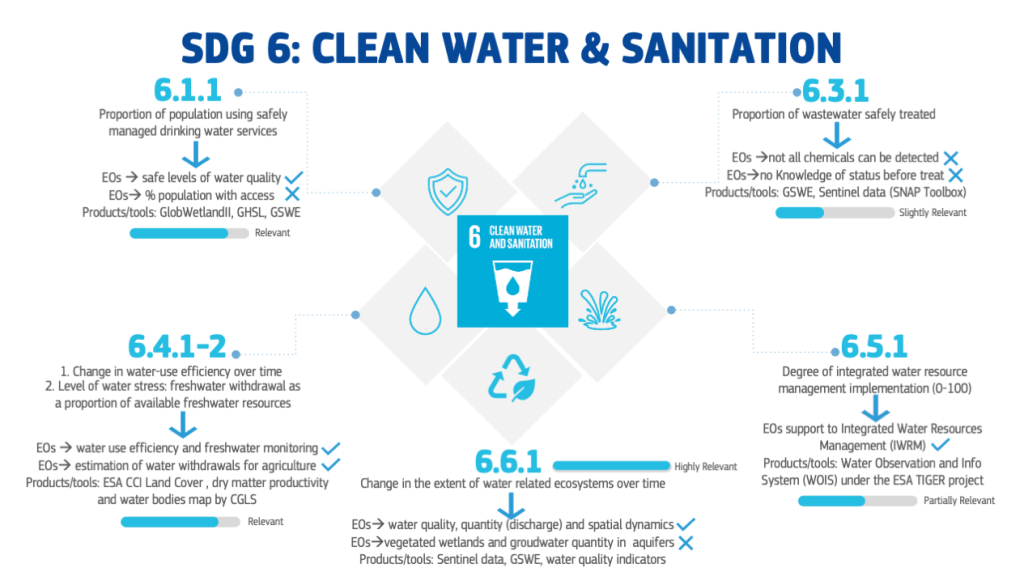
Other key products are the Global Surface Water Explorer (GSWE) that provides global coverage of surface water resources including their dynamics in the past 32 years using Landsat imagery. The GSWE is mainly used for reporting on SDG 6 on clean water and sanitation, in particular it is the reference dataset for calculating indicator 6.6.1 on the change of water related ecosystems over time, through the UN Freshwater Ecosystems Explorer. The latter integrates GSWE data on permanent and seasonal surface water and reservoir dynamics as well as data on water quality such as trophic state index and turbidity provided operationality by the Copernicus Global Land Service. Copernicus Global Land Service may further contribute to the GSWE and thus to the monitoring of SDG 6, by developing products on water quantity dynamics of lakes and reservoirs as well as river flow discharge.
The Copernicus Marine Monitoring Service offers a series of Ocean Health Monitoring Indicators, a set of Essential Variables to track ocean acidity and pH. These indicators are used for reporting in the context of SDG 14 (indicator 14.3.1) on Life below Water and have been recognised by EUROSTAT as official environmental indicators to monitor climate change. The ocean acidity product is not yet used for official SDG reporting, but it could be integrated in future iterations of the methodology, especially if enhanced scientific cooperation between modellers, remote sensing experts and ocean scientists is achieved. ESA also produces data on ocean colour that are useful to estimate the proportion of fish stocks within biologically sustainable levels (indicator 14.4.1).
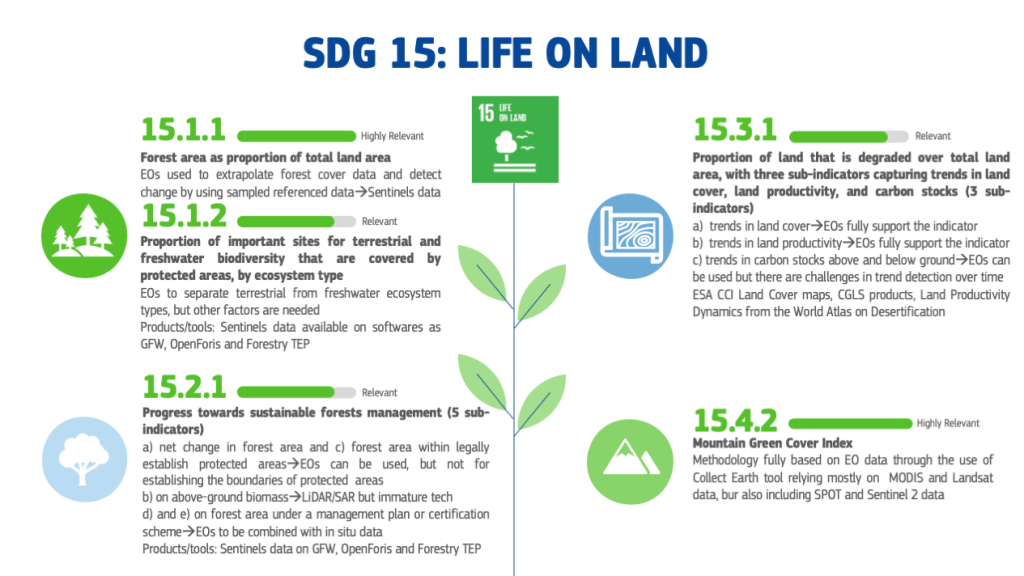
For monitoring SDG 15 (Life on Land) and in particular indicator 15.3.1 (amount of land being degraded over total land area) relevant EO products are the Land Cover from ESA Climate Change Initiative (CCI) for the land cover and land cover change data and the Land Productivity Dynamics from the World Atlas of Desertification for the land productivity data. The Mountain Green Cover Index (MGCI) is used to officially calculate the indicator 15.4.2 on the conservation of mountain ecosystems which is fully based on EO data.
A recent report by ESA provides a compendium on EO contribution to the SDG Targets and Indicators, that identifies a set of SDG indicators for whose estimation EO is playing a role. The overall contribution of EO to each indicator is assessed based on a set of criteria encompassing readiness (including for example the maturity of EO technologies or the availability of global EO data) and adequacy (including for example sensitivity to change or spatial scalability), qualitatively flagging the EO relevance for each criterion/indicator.
The overall EO relevance assigned to each SDG indicator shown in the following illustrations, is based on our synthesis across all criteria. In addition, when EO derived products are recognised as official datasets used for the SDG indicator assessment, EO is flagged as “highly relevant” by default.

Evolution of the EO value chain
All the EO-derived products and datasets mentioned play a unique role in providing a contribution to the measuring and tracking of progress towards the achievement of the SDGs. Their contribution can increase even further as the spatial-temporal resolution of data improves. Also, the completeness and continuous availability of datasets made available through user-friendly and accessible platforms can facilitate their analysis and integration within the SDG reporting system. Building consistent and integrated datasets is pivotal not only to measure trends on overall progress towards the SDGs, but also to provide decision-makers with the tools to elaborate evidence-based policies aimed at setting countries on the right path to achieving the SDGs.

As the SDGs are interlinked and very much related to each other, also the data system used to track progress against these goals needs to be fully integrated.
This is why the key element for an increased uptake of Earth Observations for SDG monitoring is the integration of EO-derived information with demographic data and socio-economic variables by statistical offices. Integrated reporting systems represent an opportunity to create synergies and complementarities with a view to improving accountability and enabling consistent and standardized reporting.
Further Readings:
Reports:
- Copernicus in support of the Sustainable Development Goals (Copernicus, 2018)
- European Global Navigation Satellite System and Copernicus: Supporting the Sustainable Development Goals (UNOOSA, 2018)
- Satellite Earth Observation in support of the Sustainable Development Goals (CEOS, 2018)
- Earth Observations for SDGs. Compendium of Earth Observation contributions to the SDG Targets and Indicators (ESA, 2020)
Web resources:
- United Nations, Sustainable Development Goals
- Sustainable development in the European Union
- How does Copernicus support the UN Sustainable Development Goals?
- ESA and the Sustainable Development Goals
- EUMETSAT Support to UN SDG
- CEOS and the Sustainable Development Goals
- Group on Earth Observations (GEO), Earth Observations for the Sustainable Development Goals
- Copernicus Workshop on Support to Sustainable Development Goals and International Agreements
| Originally Published | Last Updated | 08 Jun 2021 | 17 Mar 2022 |
| Knowledge service | Metadata | Earth Observation |
Share this page
