About
The JRC Week on Composite Indicators and Scoreboards is an annual event during which local and international policy makers, academics, think tanks, and practitioners in a wide range of fields learn from best practices and showcase their capacity to inform policies through the use of indicator systems that summarise multidimensional concepts.
This year the JRC Week on Composite Indicators and Scoreboards convened online for the first time. Over the course of four half-days, participants learned about quality-controlled methods for developing and analysing indicator frameworks and the efforts that are needed in terms of data collection, analysis and visualisation of indices and scoreboards. The training offered lessons learnt from the JRC assessments of more than 100 well-known composite indicators and scoreboards.
The Community of Practice meeting focused on sharing knowledge and experiences on data storytelling. We held a behind-the-scenes talk with practitioners from some of the world’s most known indexes as well as award winning data journalists.
Agenda
Training day 1
14:30 Opening & Introduction
| Michaela Saisana, European Commission, Joint Research Centre |
14:55 Statistics Refresher I
| Elizabeth Casabianca, European Commission, Joint Research Centre |
15:20 Step 1: Conceptual Framework
| Ana Rita Neves, European Commission, Joint Research Centre |
15:45 Step 2: Selection of Indicators
| Francesco Panella, European Commission, Joint Research Centre |
16:10 Coffee Break
16:25 Step 3: Data treatment
| Marcos Dominguez-Torreiro, European Commission, Joint Research Centre |
17:00 Step 4: Normalisation
| Giulio Caperna and Pablo de Pedraza, European Commission, Joint Research Centre |
17:20 Q&A with the COIN team
17:40 End of day 1
Training day 2
14:30 Statistics Refresher II
| William Becker, European Commission, Joint Research Centre external expert |
14:45 Step 5: Weighting
| Matija Kovacic, European Commission, Joint Research Centre |
15:15 Step 6: Aggregation
| Giulio Caperna, European Commission, Joint Research Centre |
15:40 Step 7: Statistical Coherence
| Eleni Papadimitriou, European Commission, Joint Research Centre |
16:10 Coffee Break
16:25 Toolshop: the COIN tool
| Build and audit composite indicators using Excel |
| Giulio Caperna, European Commission, Joint Research Centre |
17:20 Q&A with the COIN team
17:40 End of day 2
Training day 3
14:30 Step 8: Quality control & Robustness
| William Becker, European Commission, Joint Research Centre external expert |
15:00 Step 9: Data sensemaking
| Valentina Montalto, European Commission, Joint Research Centre |
15:20 Step 10: Visualisation & Communication
| Carlos Moura and Valentina Alberti, European Commission, Joint Research Centre |
16:10 Coffee Break
16:25 Toolshop: the COINr package
| Build and audit composite indicators using R |
| William Becker, European Commission, Joint Research Centre external expert |
17:20 Q&A with the COIN team
17:40 End of training
Community of Practice meeting: From data to stories
14:30 Opening
| Michaela Saisana |
14:40 The Composite Indicators & Scoreboards Explorer Launch
| Michaela Saisana, Carlos Moura, Ana Rita Neves |
15:00 Roundtable: How to make compelling stories with your indexes?
| As data becomes the challenge of our time, indexes have the ability to turn complex issues into digestible narratives. How do you find your key messages in the numbers? How do you make it to the media and to policymakers? In this session, we hold a behind-the-scenes talk with practitioners from some of the world’s most exciting indexes on combining data, visuals and narratives. |
| Moderation: Ana Rita Neves |
| Simon Anholt, Good Country Index Saamah Abdallah, Happy Planet Index Albert Motivans, SDG Gender Index Michael Green, Social Progress Index |
16:10 Coffee Break
16:20 Special Session: Data stories
| Data is everywhere but the ability to make sense of data remains a challenge which only a few can master. In this session, we invite data journalists and data visualization experts to share with us how they develop compelling stories with data. In a conversation with them, we ask about their favourite data stories as well as common mistakes to avoid. |
| Moderation: Valentina Alberti |
| Divyanshi Wadhwa, Junior Data Scientist, SDG Atlas 2020, World Bank John Burn-Murdoch, Data Journalist, Financial Times UK Marie Segger, Data Journalist, The Economist Pamela Duncan, Data Journalist, The Guardian |
17:40 End of the Community of Practice meeting
Meet the team
 | Michaela Saisana |
Michaela Saisana is Head of the Monitoring, Indicators and Impact Evaluation Unit and she also leads the European Commission's Competence Centre on Composite Indicators and Scoreboards (COIN) at the Joint Research Centre in Italy. She has been working in the JRC since 1998, where she obtained a prize as “best young scientist of the year” in 2004 and together with her team the “JRC policy impact award” for the Social Scoreboard of the European Pillar of Social Rights in 2018. Scientist and engineer with specialization on process optimization and spatial statistics, she is actively involved in promoting a sound development and responsible use of performance monitoring tools.These monitoring tools feed into EU policy formulation and legislation in a wide range of fields from social rights and fairness to innovation and competitiveness, from enterprises and firms to state aid, from employment to culture and creativity, from cohesion to sustainable development. She collaborates, by auditing performance indices, with over 150 international organizations and world-class universities, including the United Nations, Transparency International, Oxfam, the World Economic Forum, INSEAD, the World Intellectual Property Organization, Yale University, Columbia University, and Harvard University. Michaela graduated in 1998 from the National Technical University of Athens with a degree in Chemical Engineering (receiving the Technical Chamber of Greece Award in Chemical Engineering) and went on to complete her PhD in Chemical Engineering with focus on air quality and spatial statistics. | |
 | Marcos Domínguez-Torreiro |
Marcos Domínguez-Torreiro is a senior researcher at the “Competence Centre on Composite Indicators and Scoreboards” of the European Commission. He is specialised in policy oriented research, drawing heavily on applied statistics and econometrics. After his undergraduate studies in Economics and Business Administration, he completed his doctoral thesis in Applied Economics at the University of Vigo, Spain. His career spans academia, private sector and government. He has contributed to several books, book chapters, academic journal articles and science for policy reports in the fields of composite indicators, environmental and natural resource economics, institutional economics and finance. | |
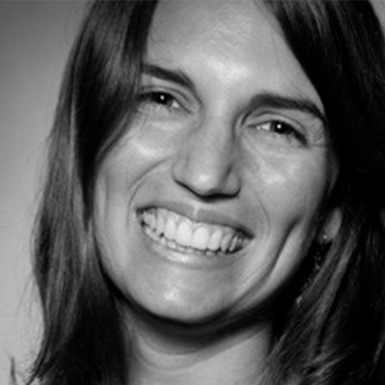 | Ana Rita Neves |
Ana Rita Neves currently works at the European Commission’s Joint Research Centre – Competence Centre on Composite Indicators and Scoreboards, where she has been part of the team developing the Composite Indicators & Scoreboards Explorer and the Asia-Europe Meeting sustainable connectivity index. Prior to joining the European Commission, Ana worked for six years at Climate Alliance, an international network of cities dedicated to climate action. At Climate Alliance, she was coordinating the development of the energy and climate reporting framework for over 7,000 cities engaged in the Covenant of Mayors initiative and involved in policy and advocacy activities linked to the international climate process. She was also an external expert evaluator of Horizon 2020, the biggest European Union's research and innovation programme. Ana has worked in research and international organisations for over 15 years at the intersection between science and policy. She holds a Ph.D. in Sustainable Energy Systems from the MIT-Portugal Programme, a Masters in Urban and Environmental Planning and a degree in Environmental Engineering. | |
 | Carlos Moura |
Carlos Moura currently works at the European Commission’s Joint Research Centre – Competence Centre on Composite Indicators and Scoreboards, where he has been part of the team developing sevreal visualization platforms as the Cultural and Creative Cities Monitor, the Social Scoreboard and the ASEM Sustainable Connectivity Portal. Prior to joining the European Commission, Carlos worked in the portuguese fisheries administration. At the fisheries administration he was responsible for managing the portuguese statistical system relating to fisheries. He develop several visual tools for controlling the fisheries and the portuguese quotas and automated the data collection procedures | |
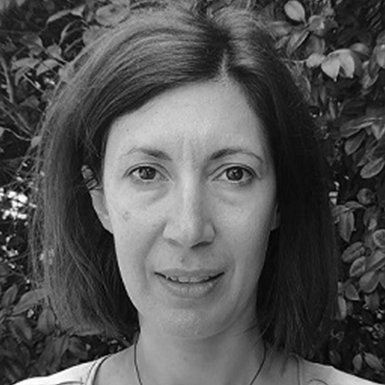 | Eleni Papadimitriou |
Eleni Papadimitriou works at the Competence Centre on Composite Indicators and Scoreboards (COIN) at the Joint Research Centre (JRC) of the European Commission. She is part of the team developing the Regional Gender Equality monitor, a monitoring tool of female disadvantage and achievement at regional EU level. Her other work interests include sustainable development, indicator frameworks and composite indicators. Prior to joining COIN, Eleni worked in the Climate Risk Management Unit of the JRC developing an index for climate resilient development and studying sustainable development indicators. Before that, in the Global Security and Crisis Management Unit, where she assisted the research on anti-fraud techniques in customs data. Her previous work experience includes also the private sector where she has a long-term experience as statistician and market research analyst. Eleni has studied Mathematics in the National Kapodestrian University of Athens and Statistics in the Athens University of Economics and Business. | |
 | Elizabeth Casabianca |
Elizabeth Casabianca is a Socio-Economic Analyst at the Joint Research Centre (JRC) of the European Commission. Her main interests lay in the field of applied microeconomics and microeconometrics, international economics, inequality and poverty. She particularly looks to carry our research with specific policy implications. Prior to joining the JRC, Elizabeth worked as an applied economist in a research and advisory company based in Bologna, where she was mainly involved in analysing the implications of economic policies on income distribution. Prior to that, she held a post-doc position at the Polytechnic University of Marche. She has also collaborated with the Trade, Gender and Development Section of UNCTAD, particularly on capacity building activities. Elizabeth has teaching experience at university level and she regularly presents her research at international conferences. | |
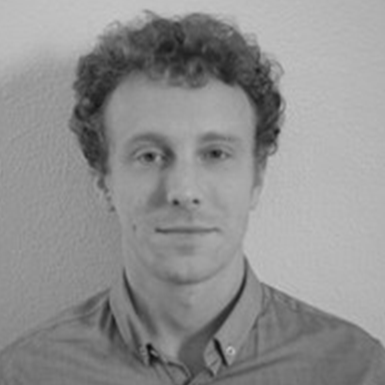 | Francesco Panella |
Francesco Panella currently works at the European Commission's Joint Research Centre, supporting research and activities in the context of cultural and creative cities. He holds an MA in Culture, Policy and Management from City University in London and a BA in Disciplines of the Arts, Music and Entertainment from Università di Bologna. | |
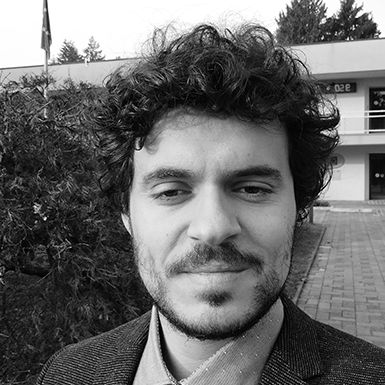 | Giulio Caperna |
Giulio Caperna is a researcher and statistician at the European Commission’s Joint Research Centre in Ispra, Italy. Before joining COIN, Giulio worked at the University of Padua as Post-Doc researcher where he taught statistics and construction of composite indicators. Before taking his PhD in Statistical Science at the University of Padua, he worked as data-manager and data-analyst in a medical department in Rome. Giulio studied Statistical Science and Demography at the “Sapienza” University of Rome. His main research interests include the methodology of composite indicators, as well as its use for the description of complex concepts such as civic participation and well-being. | |

| Matija Kovacic |
Matija Kovacic works at the Competence Centre on Composite Indicators and Scoreboards (COIN) within the Monitoring, Indicators and Impact Evaluation Unit at the Joint Research Centre (JRC) of the European Commission. He is an empirical economist mainly engaged in the analysis of inequality, fairness, and determinants of individual behavior. In addition, his activities also include the methodology of composite indicators and their empirical application. Matija holds a PhD in Economics and Doctor Europaeus in Economics from the Ca’ Foscari University of Venice, a two-years master degree from the University of Bologna and a bachelor degree from the University of Zagreb. Before joining COIN, Matija worked at the Ca’ Foscari University of Venice and University of Padua as a post-doctoral research fellow and lecturer. His other research interests include instability, climate change and conflict, and the analysis of non - economic and cultural determinants of individual preferences and decision making. | |
 | Pablo de Pedraza |
Pablo de Pedraza (PhD in Applied Economics) works for the Unit I.1 - Monitoring, Indicators and Impact Evaluation at the Joint Research Centre. He works on indexes related with Small Business Act implementation and conducts research on Modelling the data economy, the macro-matching process in the labor market, life satisfaction, job insecurity and post adjustment techniques of web data. He worked at the Applied Economics Department of the University of Salamanca and was Marie Curie fellow at the University of Amsterdam. He coordinated Webdatanet (EU Cost Action webdatanet.usal.es), a network that brought together web data experts from a variety of disciplines aiming to address methodological issues of web-based data collection. Since 2005 he is a member of the Wage Indicator foundation (http://www.wageindicator.org/main). | |
 | Valentina Montalto |
Valentina Montalto has ten years of professional experience, combing work in the private sector as researcher and project manager, and in the public sector as policy analyst, with a focus on the potential of culture for economic and social well-being. Her research interests lay in a) conceptualising the role culture in an economy that is increasingly driven by knowledge and ideas; b) developing metrics to capture the economic and social value of culture; c) advising policies at all levels – local, national, European – that can help make the most of culture to empower citizens and foster new economies. Valentina currently works at the Joint Research Centre of the European Commission, where she is in charge of the development of the ‘Cultural and Creative Cities Monitor’ project. She previously worked at the Brussels-based research and advisory company KEA where she co-authored around 15 policy-oriented reports assessing the potential of culture for local and regional development and evaluating the relevance and accuracy of available cultural statistics, on behalf of both European institutions and city authorities. On YouTube her TEDxTalk on how to measure the value of culture in European cities. | |
 | Valentina Alberti |
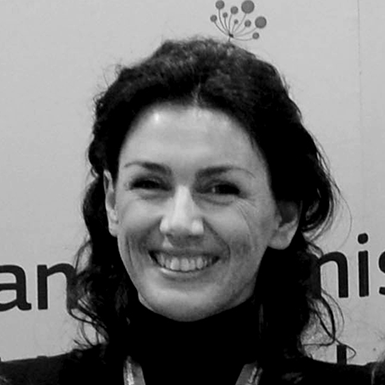
Valentina Alberti is a researcher at the European Commission, Joint Research Centre (JRC). Currently she is dealing with culture and creativity in European cities, and her research interests includes mainly regional development and urban renewal. Valentina hold a PhD in Regional and Urban Planning and a Master degree in Architecture at Sapienza, University of Rome. Passionate for visual communication, she explores communication techniques to simplify complex topics for non-experts. | |
 | William Becker |
Independent consultant, former Researcher at European Commission’s Joint Research Centre William Becker is an accomplished data scientist with extensive experience in international policy making. Originally from a technical background, he received a PhD in mechanical engineering, statistics and machine learning from the University of Sheffield in 2011. For the last nine years he has worked at the European Commission’s Joint Research Centre, supporting high-level international policy making with innovative data and policy analysis; and developing composite indicators and scoreboards for monitoring global trends. In parallel, he has built a strong cross-disciplinary academic track record, with a wide range of high-impact publications, and keynote speeches in international conferences. Applications of his work include sustainable development, international connectivity, policy/performance monitoring and impact assessment, environmental science, engineering and economics | |
Invited speakers
 | Albert Motivans |
Albert Motivans is the Head of Data and Research for Equal Measures 2030, a civil society and private sector-led data and advocacy initiative. He develops innovative approaches to identify and visualise new and existing sources of development data and to strengthen the technical capacity of national advocates to use data to improve policies and development outcomes. He led the design and analysis of the most comprehensive global tool to measure the status of girls and women - the SDG Gender Index - which was launched in June 2019. Prior to joining Equal Measures 2030, he led education statistics at the UNESCO Institute for Statistics where he oversaw the compilation of the global education database and efforts to communicate, visualise and analyse data. He has worked in the fields of data and development for the UNICEF Office of Research and the U.S. Census Bureau and has published widely on the use of data to inform policies in child welfare, education, and gender equality. He is a member of various global technical task forces, advisory groups and is an elected member of the International Statistical Institute. | |
 | Divyanshi Wadhwa |
Divyanshi Wadhwa is a Junior Data Scientist with the Development Data Group at the World Bank and works on the World Development Indicators and Gender Statistics. She was an editor for the SDG Atlas 2020 and is passionate about using data visualizations to communicate development data effectively. Prior to joining the Bank, Divyanshi worked as a Research Assistant at an international development think tank, Center for Global Development (CGD) in Washington DC. During her time at CGD, she focused her research on private sector development and illicit financial flows and helped launch a data visualization venture. An Indian national, Divyanshi holds a BA in Political Science from the University of Delhi, India and a Master’s in Public Policy from Georgetown University. | |
 | John Burn-Murdoch |
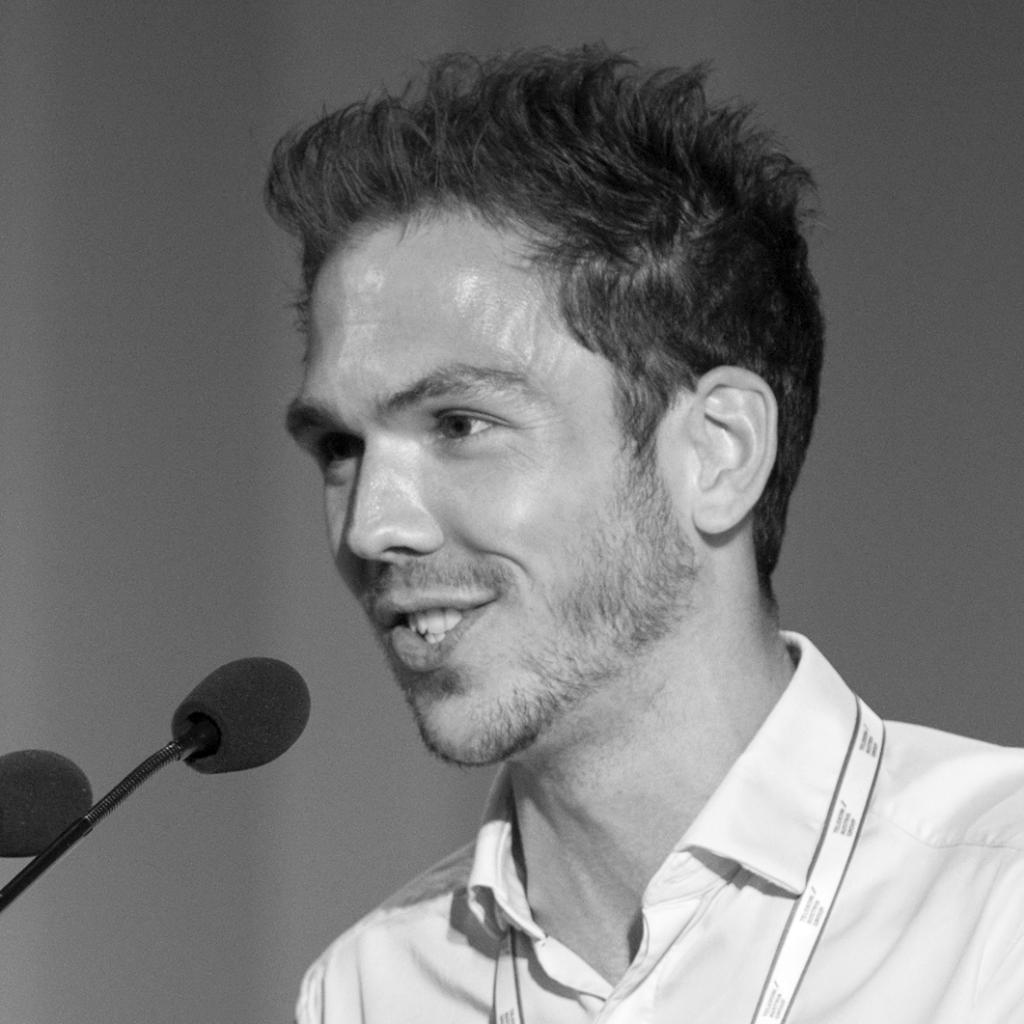
John Burn-Murdoch is the Financial Times’ chief data reporter, and creator of the FT’s coronavirus trajectory tracker charts. He has been leading the FT’s data-driven coverage of the pandemic, exploring its impacts on health, the economy and wider society. When pandemics are not happening, he also uses data and graphics to tell stories on topics including politics, economics, climate change and sport, and is a senior visiting fellow at the London School of Economics’ Data Science Institute. | |
 | Marie Segger |
Marie Segger is a data journalist for The Economist and covers a broad range of subjects from a quantitative perspective. She is the editor of Off the Charts, The Economist's weekly data newsletter, which launched in February 2021. She reports on inequality, politics and cultural trends. Marie is an experienced public speaker who regularly gives talks and guest lectures about journalism, data and data visualisations. Prior to joining The Economist in 2017, Marie was Spiegel Online’s Google News Lab fellow and she has written for a number of publications in both Britain and her native Germany. | |
 | Michael Green |
Michael Green is Chief Executive Officer of the Social Progress Imperative. An economist by training, he is co-author (with Matthew Bishop) of Philanthrocapitalism: How Giving Can Save the World and The Road from Ruin: A New Capitalism for a Big Society. Previously Michael served as a senior official in the U.K. Government’s Department for International Development, where he managed British aid programs to Russia and Ukraine and headed the communications department. He taught Economics at Warsaw University in Poland in the early 1990s. His TED Talks have been viewed more than four million times, and his 2014 Talk was chosen by the TED organization as one of the ‘most powerful ideas’ of 2014 and by The Telegraph as one of the 10 best ever. In 2016, he was named one of “The 100 Most Connected Men in Britain” by GQ Magazine and one of the NonProfit Times’s “Power & Influence Top 50.” Michael is @shepleygreen on Twitter. | |
 | Pamela Duncan |
Pamela Duncan is the acting editor of the Guardian’s Data Project team, producing high quality and exclusive data stories. She covers a range of topics including MPs receiving money from fossil fuel interests, health waiting lists, asylum issues and recently worked on the international Pandora Papers investigation. She can usually be found at her desk poring over spreadsheets, translating non-machine readable PDFs into a usable format and using coding skills - most often a combination of scraping and regex - to build datasets from previously unstructured data. She is a self-declared data evangelist who forces her love of data upon her colleagues, and offers them training whenever her workload allows. She has taught as a visiting lecturer in data journalism at City, University of London and trained journalists at conferences including DataHarvest, VVOJ, NICAR and the CIJ Summer School. She has also written a bespoke data curriculum to teach journalists in developing countries. | |
 | Saamah Abdallah |
Saamah Abdallah has worked for 15 years on the application of wellbeing science to policy and the promotion of alternative indicators of progress. He was part of the original team that developed the Happy Planet index, and has worked on various other alternative indicators, including the Thriving Places Index, the Index of Sustainable Economic Welfare, and the Santa Monica Wellbeing Index. He has advised various organisations on the measurement of wellbeing including Eurostat, Eurofound, the OECD and the UK Office for National Statistics. In 2016, he won the Community Indicators Consortium award as an emerging leader in the field of community conditions and wellbeing. | |
 | Simon Anholt |
Simon Anholt is a policy advisor, author and researcher who has provided global leadership and innovation in the public, private and nonprofit sectors. His core expertise includes the design and implementation of approaches that track, analyse and influence perceptions and behaviours at the global scale, and developing new approaches for tackling 21st-century global challenges. Anholt has advised the Heads of State and Heads of Government of 60 countries, helping them engage more ethically, imaginatively and strategically with the international community (including for example Bhutan’s groundbreaking Gross National Happiness initiative and the widely imitated StartUp Chile program). His original work on measuring and managing the images of countries has developed into a global industry. This work has been supported since 2005 by the Anholt-Ipsos Nation Brands Index, a research framework which has accumulated over a billion datapoints. In 2014, he published the Good Country Index (GCI), a ranking that analyses how much each country on earth contributes to humanity and the planet. Via a custom-built online interface, users can manipulate 28,000 simultaneous variables. The GCI is one of only three external data sources referenced in the United Nations’ 75th Anniversary Report in 2021, and features in the Annual Report of the U.S. Advisory Commission on Public Diplomacy. Further work is being conducted, in partnership with UNDP, to combine data from the GCI and the Human Development Index. In 2016, Anholt built the Global Vote, a digital platform that enables anyone anywhere to vote on the elections of other countries: a celebration and a demonstration of global interconnectedness and interdependence. Voters from 186 countries have so far participated in 31 elections. In 2017, he launched a pilot project to create the first digital nation, with a of 700 million identified citizens. Using an AI-driven deliberation platform and blockchain-based voting, the project proved the viability of an entirely self-governing nation. In 2018, Anholt created the Good Leader Index, a monthly review of the leaders who are currently doing the best (and worst) job of balancing their domestic and international responsibilities. In 2019 he announced the Good Generation, a plan for the whole world to agree on a new set of values, virtues and skills that every country on earth will teach its children, so the next generation is empowered to run towards the global challenges instead of running away from them. The Good Generation compact will be crowdsourced via an AI-moderated, natural language online conversation between children, parents and teachers in 200 countries and territories. He co-presents, with Prof. Nick Cull at the University of Southern California, the podcast People, Places and Power. Anholt is the author of six books on ethical geopolitics, Founding Editor Emeritus of the leading academic journal in the field he created, Place Branding and Public Diplomacy, and is a ten-times TEDx speaker. His first TED talk is the all-time most viewed TED talk in the ‘Government’ category with over 12 million views, and is ranked by viewers as the fourth “most inspiring” of all TED talks. His new book, The Good Country Equation, was described by Zeid Ra’ad al-Hussein, the former UN High Commissioner for Human Rights, as “a masterpiece”. Anholt has a Master’s degree in computational linguistics, anthropology and medieval French and Italian literature from Oxford University. He read International Studies at the UK’s Royal College of Defence Studies and holds an honorary Professorship in Political Science at the University of East Anglia. He served as Vice-Chair of the UK Foreign Office’s Public Diplomacy Board for 9 years, and as a Parliamentarian of the European Cultural Parliament. He is a member of the External Stakeholders Board of the Aurora Alliance of European Universities. In 2009 Professor Anholt was awarded the Nobels Colloquia Prize for Economics by a committee of 10 Nobel economists, and in 2010 the Award for Excellence in Sustainable Development at the 7th Multicultural Forum in Paris. | |
Downloads
Training Day 1
Opening and Introduction, Michaela Saisana
Statistics Refresher I, Elizabeth Casabianca
Step 1. Conceptual Framework, Ana Rita Neves
Step 2. Selection of Indicators, Francesco Panella
Step 3. Data Treatment, Marcos Dominguez-Torreiro
Step 4. Normalisation, Giulio Caperna & Pablo de Pedraza
Training Day 2
Statistics Refresher II, William Becker
Step 5. Weighting, Matija Kovacic
Step 6. Aggregation, Giulio Caperna
Step 7. Statistical Coherence, Eleni Papadimitriou
Toolshop: The COIN Excel Tool, Giulio Caperna
Training Day 3
Step 8. Quality control & Robustness, William Becker
Step 9. Data sensemaking, Valentina Montalto
Step 10. Visualisation, Carlos Moura
Step 10. Communication, Valentina Alberti
Toolshop: the COINr package, William Becker
Community of Practice
Community of Practice Highlights: From data to stories
Opening, Michaela Saisana
Happy Planet Index, Saamah Abdallah
SDG Gender Index, Albert Motivans
SDG Atlas 2020, Divyanshi Wadhwa, World Bank
Telling stories with data, Marie Segger, The Economist
Building engaging stories with data, Pamela Duncan, The Guardian
Videos
30 November | Training
1 December | Training
2 December | Training
3 December | Community of Practice
More editions
2023 - JRC Week on Composite Indicators and Scoreboards
2019 - JRC Week on Composite Indicators and Scoreboards
2018 - JRC Week on Composite Indicators and Scoreboards
2017 - JRC Week on Composite Indicators and Scoreboards
| Originally Published | Last Updated | 09 Mar 2020 | 02 Oct 2023 |
| Knowledge service | Metadata | Composite Indicators |
Share this page
